402 results found
-
3 votes
It is implemented for the next release
-
Allow stacks to have there own xaxis label when grouping
When creating multiple groups with stacks allow not only for the groups to have an xaxis but also for each of the stacks to have there own xaxis as well.
3 votesThis is added in the next version, shipping in a few days.
-
3D Pie/Bar charts
Add 3D style for pie and bar charts(for instance: add shadow at the edge of pie and slice so that makes it looks like 3D)
36 votes -
Draw an area between two line-charts...
... without stagging. That means showing the real datapoints of the top line.
1 voteThat’s an arearange series.
-
When exporting charts don't show the hidden curves.
Eg : A user is given a chart with 5 series and has decided 2 of them they don't want to plot and disables them. When they export to either a file or printer the export needs to reflect those preferences.
8 votes -
confidence intervals / error bands
It would be so useful to have support for confidence intervals (error bands), as shown here: http://dygraphs.com/
Thank you!81 votesRange series are available as of Highcharts 2.3 and Highstock 1.2
-
Specify a minimum unit for dateTimeLabelFormats
If you are charting daily data with a maxZoom of 7 days, the labels show as hourly. I'd like the ability to specify the minimum unit to display as a label for Specify a minimum unit for dateTimeLabelFormats (like days or weeks).
96 votes -
Only run MouseTracker:tooltipInterval when over
tooltipInterval is firing every 32ms regardless of the whether or not mouse is over the Chart.
The setInterval should only be created on mouseenter and cleared on mouseleave.14 votesIt is fixed in the development branch
-
Category-ready crosshairs
Right now, the crosshairs option draws a line of fixed width (usually quite thin). This looks cool... until you switch to a category-based chart.
In a chart with categories, the crosshair is just a thin line runnign through the centre of the category.
It would be very nice to have an option to highlight the entire category, or to make a crosshair line as wide as the distance between ticks (assuming arbitrary zoom).
(This can be done by setting plotBands in the tooltip formatter function, but that method seems rather hack-ish)
3 votes -
Improved Text Renderer: Line Wrapping
This might go hand-in-hand with some of the other requests about wrapping labels, legends & titles. I would like to see a function that works like the text() method of the renderer but with automatic line wrapping.
I am imagining something like this:
chart.renderer.textbox('long text here', left, top, width, height, clip);
clip would allow you to specify if the text can overflow or be clipped.
Ideally, perhaps it would be better if it worked like text in a div and had similar justification and clipping options.
3 votesSee http://jsfiddle.net/highcharts/WnFAM/. The implementation uses CSS width.
-
Provide option to automatically wrap long labels
Wrap long text labels on axes.
There is a nice summary of the enhancement request here, http://highslide.com/forum/viewtopic.php?f=9&t=8380&p=39252&hilit=wrap#p39252
22 votes -
timeseries interval preselects
when rendering timeseries is very common to have some predefined options like : lastweek/week, lastmonth/month, last_year/year and a subgraph with a slider with an interval selector. An example (maybe not the best) http://finance.yahoo.com/echarts?s=^DJI+Interactive#chart1:symbol=^dji;range=1y;indicator=volume;charttype=line;crosshair=on;ohlcvalues=0;logscale=on;source=undefined
1 vote -
Scatter Plot with images
The ability to add images for scatter plot points.
3 votesThis is already possible by using markers and a url for symbol. See the demo page.
-
Automatic line break for title and legend labels
Currently titles are always rendered in one line. (Although it is possible to use a br Tag, but it is hard to calculate where to insert a br and the rest of the chart is not automatically shifted.)
It would be great to have an automatic line break for long titles and/or long legend labels and an auto shift of the other chart content.358 votesCompleted as of Highcharts 3.0.3. See http://jsfiddle.net/highcharts/NVmV5/
-
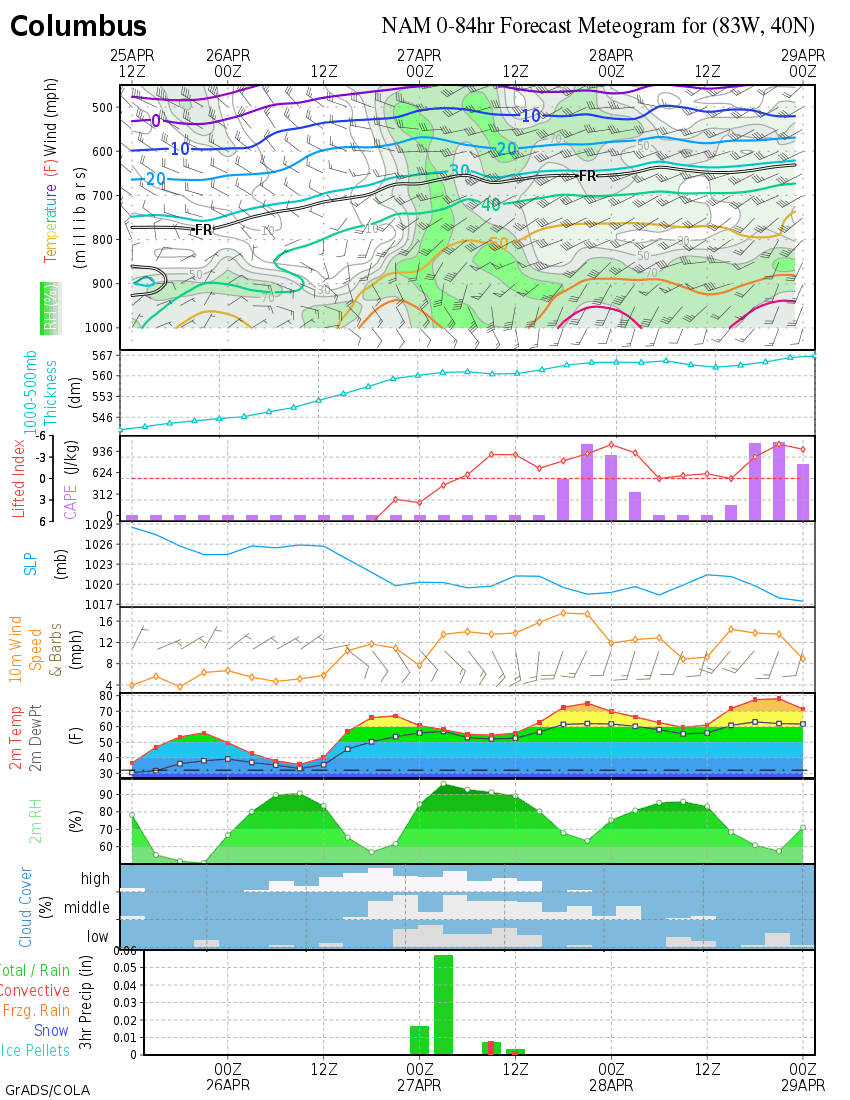
wind barb and vector plot
It would be very useful to be capable of plotting wind barb and vector arrow as a type of plot. This would allow us to plot 2 dimensional data (value, direction) alongside other line or column plots (i.e. temperature, pressure, etc.)
Example:
wind barb:
- http://weather.unisys.com/surface/meteogram/met_KBOS.gif
- http://wxmaps.org/pix/cmhnam.png
- http://www.meteoblue.com/public/fileadmin/meteoblue/pictures/Products/POINT_meteogram_day6_wind_080428.pngVector:
http://www.nortekusa.com/usa/library/images/duck-awac-8m-wave-vector-plot
http://www.marineweather.co.nz/forecasts/north-cape
- http://www.seabreeze.com.au/graphs/tasmania.asp34 votesWind barb is here:
https://www.highcharts.com/docs/chart-and-series-types/wind-barbs-seriesVector is here:
https://www.highcharts.com/docs/chart-and-series-types/vector-plot -
Scrolling legends
If the legend has more entries than fit on the screen it could create a scrollbar. This removes the burden from the developer to collapse all items after a given depth.
83 votes2012-05-15: Implemented scrolling legend: http://jsfiddle.net/highcharts/3Yd7B/
2011: I created the POC for using a HTML div for the legend items: http://jsfiddle.net/highcharts/nULxz/
For now it should be considered a hack. It has obvious weaknesses like unability to show marker symbols, and invisibility in export, but having a scrollbar in a static image doesn’t make much sense anyway.
Also the hack doesn’t reflect dynamic changes to the series of the chart.
-
115 votes
-
server side support
True server side or web services support so that I can post data and get a jpg back. I tried doing this my self with Rhino and env.js but didn't ever get it to work. The svg that was generated by High Charts had several issues that I have discussed on the forum
109 votes -
42 votes
Completed, see http://jsfiddle.net/highcharts/7CLjy/
-
support rtl
support languages that are written right to left like hebrew
57 votes
- Don't see your idea?