wind barb and vector plot
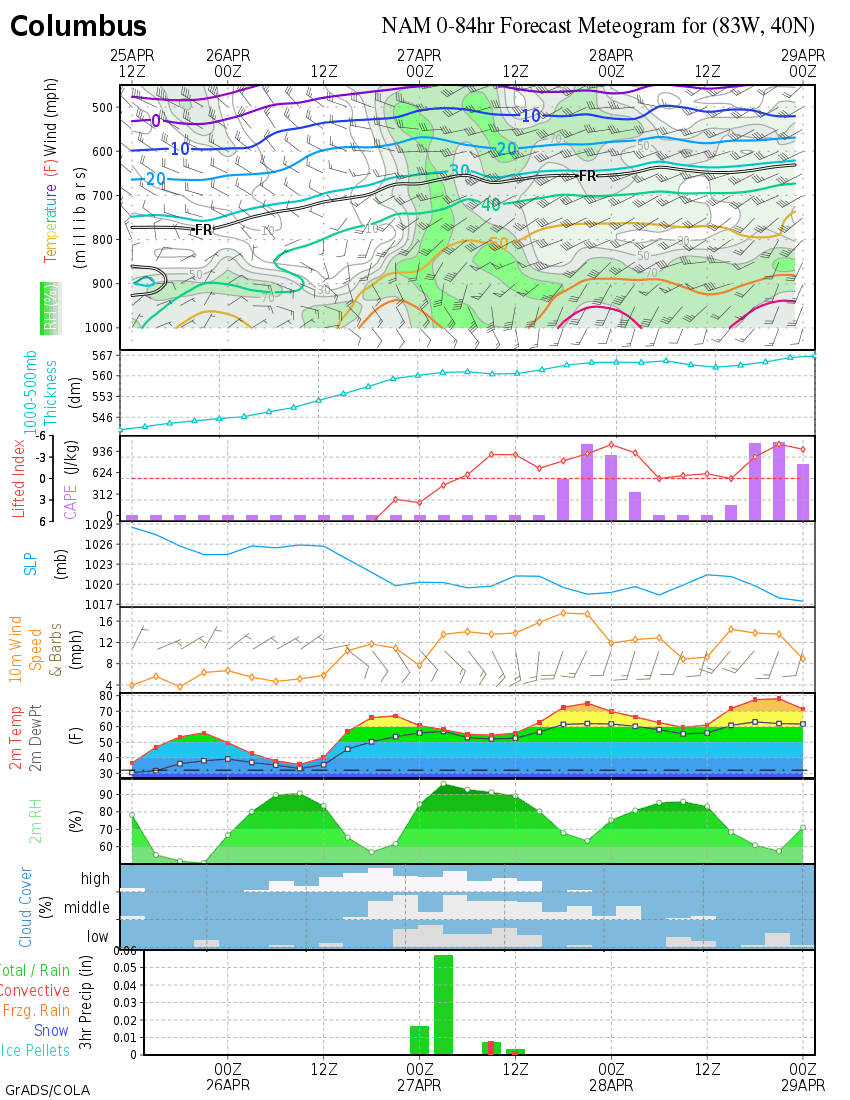
It would be very useful to be capable of plotting wind barb and vector arrow as a type of plot. This would allow us to plot 2 dimensional data (value, direction) alongside other line or column plots (i.e. temperature, pressure, etc.)
Example:
wind barb:
- http://weather.unisys.com/surface/meteogram/met_KBOS.gif
- http://wxmaps.org/pix/cmhnam.png
- http://www.meteoblue.com/public/fileadmin/meteoblue/pictures/Products/POINT_meteogram_day6_wind_080428.png
Vector:
http://www.nortekusa.com/usa/library/images/duck-awac-8m-wave-vector-plot
http://www.marineweather.co.nz/forecasts/north-cape
- http://www.seabreeze.com.au/graphs/tasmania.asp
Wind barb is here:
https://www.highcharts.com/docs/chart-and-series-types/wind-barbs-series
Vector is here:
https://www.highcharts.com/docs/chart-and-series-types/vector-plot