1084 results found
-
Data labels with collision avoidance and connectors for scatter and bubble charts
Scatter and bubble charts do not seem to support collision avoidance for data labels. Along with collision avoidance, connectors that link the points to the data labels would be very helpful.
Thank you for the great library.
24 votesAs you can see from http://jsfiddle.net/highcharts/2cu52v0e/, there is currently collision avoidance.
It hides colliding data labels, but it doesn’t move them, and subsequently doesn’t add connectors.
-
Marker Clusters in HighMaps
See example below:
https://www.mapbox.com/mapbox.js/example/v1.0.0/leaflet-markercluster/
46 votes -
Create some form of tree / node linking chart
Highcharts doesn't currently appear to have any tree / node linking chart types. A few examples would be:
- Dendograms: https://en.wikipedia.org/wiki/Dendrogram
- Hierarchical clustering: https://en.wikipedia.org/wiki/Hierarchical_clustering
- Minimum Spanning Tree: https://en.wikipedia.org/wiki/Minimum_spanning_tree
The above chart types vary in their purpose and how they are constructed. But this request is simply to have some form of tree / node linking chart capabilities in highcharts.
Once it becomes possible to chart a basic tree or hierarchy structure, it may be easier to extend functionality to create further chart types along the same thinking.
Plot.ly currently offers both dendrogram's and tree plots within their python API. But of…
38 votesThanks for writing! We have support for treemaps in Highcharts 4, and we’re considering adding the related hyperbolic tree maps after the release of HC5.
-
Allow zero and negative values in logarithmic axes
where:
log(0) === 0
log (-x) === log(x) * -134 votes -
Beeswarm plot (aka. strip chart / dot plot)
It would be great to have a simple dot plot in HighCharts. Categorical data with a single value, displayed with sideways jitter to prevent dots overlapping. The advantage of this plot is that it is great at showing distributions. It's also simple to interpret and good with large numbers of data points.
There are several R packages that do this (beeswarm being the main one). See http://www.cbs.dtu.dk/~eklund/beeswarm/
Bonus points for dealing with overlapping plots intelligently (see beewarm package 'corral' options). Perhaps automatic point sizing?
12 votes -
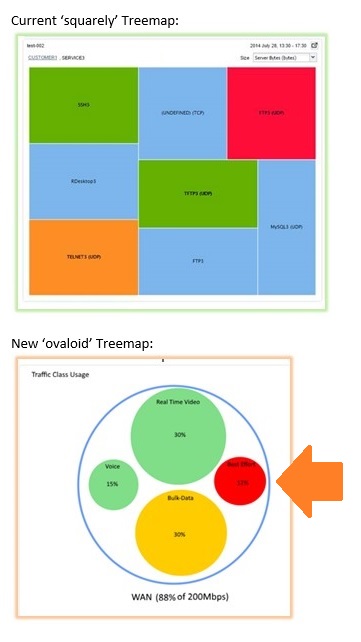
Circular Treemap charts
Instead of having Treemap as groups of rectangles, we can have it as group of circles.
Something like this:
- http://coolmoviebrowser.free.fr/img/circular-treemap.jpg
- http://www.addictivetips.com/windows-tips/analyze-disk-space-usage-via-7-tree-based-data-structure-visualization-treeviz/Hope you can do it :)
Regards,
Sorinel20 votes -
data module for database tables
data module was a great addition. have been using that pretty much everytime i can covert my data to csv.
but having database module to load data from one table would be just awesome.
116 votesMaking backends for data bases is complex, as it covers a wide range of different databases and languages. A project like this would have to start with only a few of the most popular backends. We are currently considering a “connectivity” project that will do some of this.
-
Percentage for multiple series bar chart
The stacked chart currently have percentage option which shows the percentages across a single category. But that is not available for bar or column chart without stacking. It would be really helpful to have this built in
6 votes -
Highmaps: Map Collection does not have world map with disputed areas
The world map provided in Map Collection does not show disputed areas of countries. It would be really helpful if the disputed area of Jammu & Kashmir state is shown as part of India in world.json
India with Jammu & Kashmir:
http://jsfiddle.net/gh/get/jquery/1.11.0/highslide-software/highcharts.com/tree/master/samples/mapdata/countries/in/custom/in-all-disputedWorld Map with a part of Jammu and Kashmir missing from India:
http://jsfiddle.net/gh/get/jquery/1.11.0/highslide-software/highcharts.com/tree/master/samples/mapdata/custom/world-lowres51 votes -
Add stacking range in column charts
I am creating a column chart with Highcharts and I want to stack the values by time. So the xAxis is of type datetime. If the date sent is identical then the stacking is working right but if there is a second of difference, then it's not stacking well and the user experience is weird. A possible solution would be to add a stack range in order to group the similar date values. You can find my Stackoverflow question here with an image and a fiddle: http://stackoverflow.com/questions/39788944/highcharts-column-chart-stacked-not-showing-all-the-values
4 votes -
Title and Chartnames To Be Selectable with mouse .Would You Please Add this opprtunity?
I can't select the title and the chart categories . In some situations I need to select and copy those strings . Would You Please Add this opportunity ASAP?
34 votesHi, this feature is prevented in two places, because there were problems with text being selected when trying to zoom in. See https://github.com/highcharts/highcharts/issues/3224.
If you want to enable text selection, there are two lines where the event handling is prevented. If you comment out both these lines, your users can select text:
- https://github.com/highcharts/highcharts/blob/v5.0.14/js/parts/Pointer.js#L756
- https://github.com/highcharts/highcharts/blob/v5.0.14/js/parts/Pointer.js#L813 -
Limit the number of items per line in legend
I've created javascript functions to automate some char creations.
I may not know what the names of my series will be, nor their length, but I know how I want to organize them in my legend (2x3, 2x2, ...).
It would be great if we could set in the legend's options the number max of items per line.
20 votes -
Support more 3D chart types
I suggest Highcharts add support for 3D line, spline, area, areaspline, and step charts. The current support where a 2D chart is superimposed on 3D axes is unusable.
7 votes -
Bar/Column Stacked Chart Labels like Pie Chart?
It would be nice if it is possible to create a bar chart with labels like the pie chart. I need to be able to create the labels outside the column and create that line to them. Just like the pie chart does here:
http://www.highcharts.com/demo/pie-basicI have a Stacked Bar Chart that shows percentages and the labels wont be visible if the value is too small. or if I make them visible they will be overlapping.
Here is an Example Fiddle to show the problem
http://jsfiddle.net/xdbLscn7/24 votes -
Can you please advise if i want to create pointer line between bubble and label ?
Hello, today I want to modify bubble chart to have a label and line from label pointing to any bubble, that something like pie chart have a label and line pointing to any piece of pie chart.
This time it's possible to do that or have any idea ?
Thank you. :)
9 votes -
Zoom the background Image along with the axis in scatter charts
Right now in the Scatter chart the zoom function only zooms the value and the axis. I suggest let it zoom the background image also. So image below the clip box will be the new image of the zoomed chart
14 votes -
Color axis support for map with levels
Color axis support for map with levels
https://github.com/highslide-software/highcharts.com/issues/4551Even GeoMap needs same kind of support:
See below cateogy map demo of GeoMap
http://www.highcharts.com/maps/demo/category-mapHere using color intesityif want to show which area has more sale i cant do it easily.
25 votes -
Add option to set a minimum slice size in a pie chart
There is minPointLength for bar charts, but nothing for pie charts. When we have a pie chart in which the numbers differ greatly, the smaller sections are not visible.
46 votes -
redraw chart on mobile orientation change
With Highchart version 3.0, the chart does not get rendered on mobile orientation change. I am not sure if this is available with Hightchart ?
4 votesHighcharts doesn’t do anything internally on orientation change, except it reflows if the window.resize event fires.
You can add your own listeners to orientation change though.
What does the case look like? Is there a problem?
-
PlotLines and yAxis Labels Overlap Fix
When overlap of text occur -> automatically subtract the y coordinate of label by font size.
This can serve any kind of text overlap really.6 votes
- Don't see your idea?