- or
17 results found
-
630 votes
Treemaps is currently under development, but here is a small taste of what you can expect in the future.
At the moment there is four algorithms implemented to get users up and running quickly. These are the SliceAndDice, Stripes, Squarified, and Strip algorithm. By extending the series object, the users can also add their own algorithms for layouting the data.
A levels object is introduced to let the users set wanted options to a specific level, this is displayed in some of the demos. The levels object is great for using a mix of several algorithms in the same chart.Demos:
- http://jsfiddle.net/highcharts/sqxqq1ry/
- http://jsfiddle.net/highcharts/pa1eoqps/
- http://jsfiddle.net/highcharts/tm720ufm/ -
Create some form of tree / node linking chart
Highcharts doesn't currently appear to have any tree / node linking chart types. A few examples would be:
- Dendograms: https://en.wikipedia.org/wiki/Dendrogram
- Hierarchical clustering: https://en.wikipedia.org/wiki/Hierarchical_clustering
- Minimum Spanning Tree: https://en.wikipedia.org/wiki/Minimum_spanning_tree
The above chart types vary in their purpose and how they are constructed. But this request is simply to have some form of tree / node linking chart capabilities in highcharts.
Once it becomes possible to chart a basic tree or hierarchy structure, it may be easier to extend functionality to create further chart types along the same thinking.
Plot.ly currently offers both dendrogram's and tree plots within their python API.…
38 votesThanks for writing! We have support for treemaps in Highcharts 4, and we’re considering adding the related hyperbolic tree maps after the release of HC5.
-
genealogy family tree charts with multiple parents,i want to build family structure dynamically
genealogy family tree charts with multiple parents,i want to build family structure dynamically
12 votes -
"Highmap" - Represent data structures like Array, Tree, Hash table etc. Mindmap.
Interactive with easy collapse/expand.
8 votes -
Highmaps: Map Collection does not have world map with disputed areas
The world map provided in Map Collection does not show disputed areas of countries. It would be really helpful if the disputed area of Jammu & Kashmir state is shown as part of India in world.json
India with Jammu & Kashmir:
http://jsfiddle.net/gh/get/jquery/1.11.0/highslide-software/highcharts.com/tree/master/samples/mapdata/countries/in/custom/in-all-disputedWorld Map with a part of Jammu and Kashmir missing from India:
http://jsfiddle.net/gh/get/jquery/1.11.0/highslide-software/highcharts.com/tree/master/samples/mapdata/custom/world-lowres51 votes -
Any chance of summarised data in a drill down tree view?
Excellent product by the way.
2 votes -
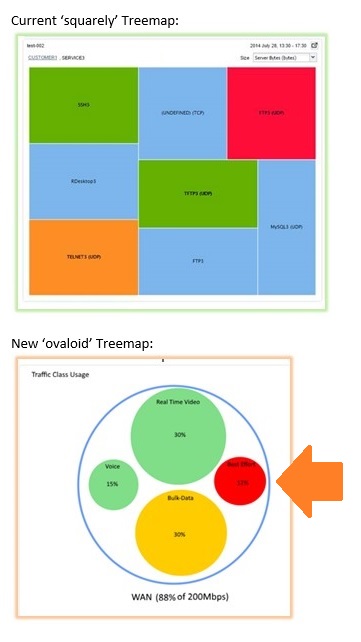
Circular Treemap charts
Instead of having Treemap as groups of rectangles, we can have it as group of circles.
Something like this:
- http://coolmoviebrowser.free.fr/img/circular-treemap.jpg
- http://www.addictivetips.com/windows-tips/analyze-disk-space-usage-via-7-tree-based-data-structure-visualization-treeviz/Hope you can do it :)
Regards,
Sorinel20 votes -
Visualizing Graph data
It'd be great if we can visualize a graph/tree using Highcharts library.
2 votes -
Change adaptToUpdatedData value dynamically
We have a dynamic Dataset refreshing each 5 sec on the chart
like:http://jsfiddle.net/gh/get/jquery/1.9.1/highslide-software/highcharts.com/tree/master/samples/stock/demo/dynamic-update/
and we would like to Fetch ( async ) data when the user select a range in the middle of the chart. means the adaptToUpdatedData value passes from true to false. But right now to do so we need to re-create the chart with adaptToUpdatedData = false. like:
http://jsfiddle.net/gh/get/jquery/1.9.1/highslide-software/highcharts.com/tree/master/samples/stock/demo/lazy-loading/
Question is: Can we switch dynamically from real time (adaptToUpdatedData = true ) to fetch async (adaptToUpdatedData = false ) ?
And each time the cursor of the navigator is on the right…4 votes -
Better documentation page
First of, I think the documentation page would be more helpful if I could just out right Ctrl+f search through it.
Second, I don't know if this is an issue for anyone else, but having different occurrences of the same term multiple times makes it confusing as to how to configure and/or use it.
For example "series" appears at least 3 times in the documentation tree as it is.
->series
->plotOptions->series
Obj->series6 votes -
how the x-range yAlias categories text Align left?
I use a x-range component, I need the yAlias categories text Align left? how can I do it ? the url is http://jsfiddle.net/gh/get/jquery/1.7.2/highslide-software/highcharts.com/tree/master/samples/highcharts/studies/xrange-series/
1 voteSet align: left. But you need to set a margin to the chart as well. http://jsfiddle.net/highcharts/5qzw3n6r/
-
Highcharts drilldown with breadcrumb
Provide a standard way to get highchart drilldown with breadcrumb navigation.
For example in the fiddle
https://jsfiddle.net/gh/get/library/pure/highcharts/highcharts/tree/master/samples/highcharts/demo/pie-drilldown/
where browsers data is present, a simple breadcrump should be displayed like "browsers / chrome".1 voteThanks for sharing the idea!
We are working on that feature. You can check the updates on our GitHub ticket: https://github.com/highcharts/highcharts/issues/12528
Kind Regards,
Paweł -
marker
Hi All,
I am trying to add custom markers in HighStock charts. I found that it is possible in highcharts only. Can someone help me to resolve it issue?
I want to below example in HighStock where i can define my own markers:
https://jsfiddle.net/gh/get/library/pure/highcharts/highcharts/tree/master/samples/highcharts/demo/spline-symbols/1 voteIt’s possible in Highstock too, the only difference is that markers are disabled by default, so you need to set enabled: true. https://jsfiddle.net/highcharts/3mpLsfhc/
-
Improve navigator.series documentation
In the (highstock) navigator.series documentation there is no data property mentioned (https://api.highcharts.com/highstock/navigator.series), however in your example (https://jsfiddle.net/gh/get/library/pure/highcharts/highcharts/tree/master/samples/stock/navigator/series-data/) you provide a data attribute.
I guess you covered it with the sentence in the introduction 'Available options are the same as any series'. But the problem is if it is not reflected in the documentation it is not available in TypeScript (because I think you generated the sources out of the documentation?)
Would be great if you can adjust the documentation (and TS type for NavigatorSeriesOptions)
3 votes -
a property to change height/width of the small scrollbar-buttons
We are using a touchscreen.
At highchart there are two small buttons over the scrollbarbutton.I am not able to change the dimensions of this small buttons which are used to change the timeselection.
This property can also be combined with the dimension of the scrollbar { height: XX, width: XX}1 vote -
Add double slash rendering on axis to simple break
Simple breaks may be quite confusing now because the reader of the chart has no indications of the occurrence of a break in the axis. It would be very nice to add to the simple break an axis cut by too slashes same way as shown on the Y axis of this sample : http://jsfiddle.net/gh/get/jquery/2/highcharts/highcharts/tree/master/samples/highcharts/axisbreak/break-visualized/
It would be very nice to have such feature configurable through highcharts editor
visualization of the break in the graph itself is a more advanced feature that could be addressed in javascript because it depends much on the type of graph.
3 votesYes I agree this should be the default visualization. We need an option to turn it on or off though, as it would probably become too obtrusive for stock chart x axes where there is a break every night. Also, the Y axis by default has no line width, so the break by default would be invisible.
Any suggestions?
-
update sudan map
i found that Sudan map is not updated , (WEST Kordofan State) is not included in the map of the states of the Sudan;
which is published in the following link to be used as source map for web based data visualization projectshttps://code.highcharts.com/mapdata/countries/sd/custom/sd-all-disputed.svg
https://jsfiddle.net/gh/get/jquery/1.11.0/highslide-software/highcharts.com/tree/master/samples/mapdata/countries/sd/custom/sd-all-disputed.We will be very thankful if the Sudan map is updated. The up to date map is attached in geojson format. and also the map image included in the link of the official UN website https://www.unocha.org/sudan.
1 vote
- Don't see your idea?