1084 results found
-
Tap&Drag zooming for line charts on touch input devices
Currently users on mobile devices have to zoom by pinching. However, this method of zooming is very inaccurate and in a stock data scenario rarely does what the user intended.
Add an option to change pinch-zoom for tap&drag zoom that basically simulates how it works with a mouse on desktop. Zooming would occur by tapping and dragging the finger across the screen. Panning can be achieved with a scroll bar if needed.
6 votes -
Dynamic description
Currently the chart.description property accepts a string.
If there was a chart.descriptionFormatter or similar property that expected a function. If this function was passed the chart data then it would be fairly trivial to make dynamic descriptions.
This would be fantastic for accessibility too in dynamic cases such as stock charts. Knowing that it is a line chart the developer could easily write a function that could return something along the lines of:
"This is a line chart showing Acme Co's stock price between {startDate} and {endDate}. In that period the price has [risen to|fallen to|remained stable at] ${price}. Volatility…
3 votesThis is a great and simple idea to implement.
-
feature to drag sku from chart to empty bookmark component(another empty chart)
feature to drag series point and drop in another chart which is empty(like a series bookmark holder)
3 votes -
Differentiate the "touch" and "touch and hold" gestures on mobile device
I noticed that the out of box Highcharts tooltip behavior today is: On desktop, mouse hover will show the tooltip; On mobile device, touch on a chart series will show the tooltip.
No we are having the following requirement for Highcharts tooltip on mobile device:
- Touch on the chart series will trigger an event, e.g: chart drilldown
- Touch and hold on the chart series will show the chart tooltip.
Is that possible for Highcharts library to differentiate between "touch" and "touch and hold" gestures on mobile device?
7 votes -
add events to axis labels
there should be standard events like mouseOut, mouseOver, click , etc. available for axis labels. currently it is possible to do it through custom events plugin, but it is not compatible with latest highcharts
1 voteThe Pointer object has a nice utility that you can use to detect whether a certain class is clicked: http://jsfiddle.net/qcehvqqk/
-
make a map of the Appalachia region in the United States
Please create a map of the Appalachia region in the United States.
7 votes -
Dynamic labels for treemap
Size of treemap labels autosize according to the size of squares
e.g. http://d3plus.org/examples/advanced/10305148/1 vote -
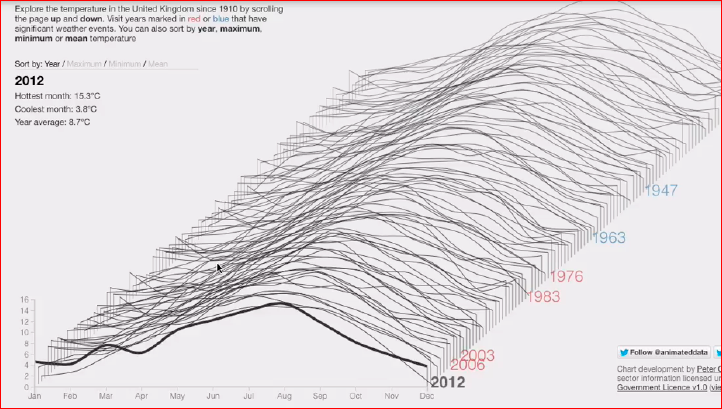
Support 3d line charts with multiple series
At the moment there is no support for 3d line charts with multiple series. Something like this
https://habrastorage.org/getpro/habr/post_images/c82/1f8/8fe/c821f88fe784e852dab621227f2d1c52.png7 votesThanks for writing. It would be like http://jsfiddle.net/gh/get/library/pure/highcharts/highcharts/tree/samples/highcharts/3d/column-grouping/, except with a line chart instead of column.
-
SVG marker symbol sizing by height and width instead of radius
I have a project where I needed to add mean diamonds to a boxplot, and I have a working prototype where the height and width of the marker symbol are used instead of the radius. The marker height needs to stretch or shrink based on a data value instead of being fixed by a radius value. Below is a shim that I wrote that modifies the Series markerAttribs function. Can you take a look at this function and find a way to integrate it into a future release?
Thanks,
Jeremy//Taken (and altered) from highcharts.src.js (v5.0.7) line 17497
Highcharts.Series.prototype.markerAttribs =…1 vote -
Pagination facility providing is most important for bar charts
Pagination facility providing is most important for bar charts
3 votesWe don’t have pagination currently, but you can add a scrollbar to the X axis: http://utils.highcharts.local/samples/#view/stock/yaxis/inverted-bar-scrollbar
-
Xamarin Wrapper
Would be great to have a native Xamarin support. Right now the solution is to use a webView, which is not ideal.
5 votes -
Huge data export
I have a million data on my chart , that i need to export with help of excel 2010 and above..
Is there any way from high chart, because we are using highchart boost for million data drawing in chart.
4 votes -
Make categories a valid JSON object.
Make categories a valid JSON object. Much easier to use JSON option SQL Server 2016. See functionality SQL Server 2016 for JSON. I want to set categories in Highcharts like so:
categories: [{"name":"apples"},{"name":"bananas"},{"name":"kiwis"}]
Or something else for 'name'. Now I have to use a trick with XML and STUFF to get it like ["apples", "bananas","kiwis"].
1 vote -
I want a tooltip which contains an anchor.
I want a tooltip which contains an anchor. On clicking the link inside the tooltip, it should open the link.
1 vote -
Release SVG to Map as a independent tool
Today we have a tool in http://www.highcharts.com/studies/map-from-svg.htm that actually works...
But, that tool does not work as a "independent" tool, running in NodeJS, for example, and because of that it is simply not usable to convert maps in mass, passing multiple files and converting everything with just one command.
Please, release that tool as a independent NodeJS tool, installable via NPM!
3 votes -
Drag whole chart to move around, not part of them
Drag whole chart to move around, not part of them.
So it could put to any place by a designer3 votes -
KAGI Chart and Point & Figure Chart
Can we have highcharts extension/module which can create kagi chart and point & figure chart similar to http://stockcharts.com/school/doku.php?id=chart_school:chart_analysis:kagi and http://stockcharts.com/freecharts/pnf.php?c=$INDU,P
7 votes -
Zone based data grouping
I want to have a chart where I can draw a kind of circle on it in which the circle contains a set of plotted points and I can update them by dragging the circle towards any place in the graph
1 vote -
Activity gauge - gradient with animation
Hi All,
I'm making a dashboard using Activity Gauge (http://www.highcharts.com/demo/gauge-activity) to show data.
I need to make it with gradient effect like darker to lighter which seems not possible with linear or radial gradient logically it seems not possible.
some how I have written an script with the help of support guy but seems not perfect solution as it do not have good visualisation and performance on browsers (very slower to load) see my samples -
http://jsfiddle.net/td2v4u4z/47/
http://jsfiddle.net/td2v4u4z/48/
http://jsfiddle.net/td2v4u4z/52/I need charts with more sharp lines and clean curves like http://www.highcharts.com/demo/gauge-activity
Can any one suggest me the perfect…
27 votes -
Running average
Can we get a feature added to the scatter plots such that a Running Average trend-line can be added, with a average point calculated every X number of input data points. And X is some integer added by the user.
1 vote
- Don't see your idea?