1084 results found
-
Fix ISO 3166-2 codes for AU maps
We have noticed that the australian geojson maps in the collection do not implements the https://en.wikipedia.org/wiki/ISO_3166-2:AU standard correctly, for New South Wales and Australian Capital Territory. Can you fix that please?
10 votes -
CBSA
Is there any way to plot US map with cbsa boundaries ?
2 votes -
Stacked Area chart for irregular interval data points
When you create a stacked area chart, the areas only stack properly when the data points are at even intervals. This is often not the case, and so the data displays as points and pieces of area (http://jsfiddle.net/ze5fx67d/).
It would be ideal to have the ability to stack values despite irregular intervals, stacking based on the closest "nearby" data point, but currently it fails to stack at all.
9 votes -
Drilling down to City Level
I want highmaps to drilldown locations to city level specially for USA.
12 votes -
Do we have option to generate Smith Charts?
We have a requirement to generate Smith Charts. Can Highcharts support Smith Charts?
1 voteCurrently Smith charts can’t be drawn with Highcharts out of the box.
-
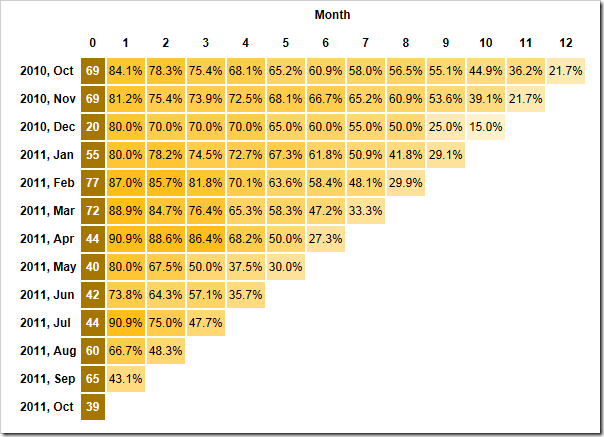
Graph of Cohort Analysis
What is Cohort Analysis - https://en.wikipedia.org/wiki/Cohort_analysis
Example Graph of Cohort Analysis - http://blogs.thesitedoctor.co.uk/tim/images/How-to-read-and-interpret-a-Cohort-Trian_FC17/Cohort-Created-To-Last-Purchse3.png
21 votes -
Include CSS for each example theme like grid.css
The CSS for each of the existing example themes should become part of the product download. Please see this forum post: https://forum.highcharts.com/post135634.html#p135634 t
1 vote -
3 votes
-
8 votes
-
hoverable tooltips for axes plot lines
In our application, I have created tooltips for plot lines by dynamically modifying the chart configuration when the plot line is hovered over. I think it would be useful to provide this option as a configuration setting, or highcharts plugin to enable this.
Example JS fiddle: http://jsfiddle.net/tw6rmc1r/2/
10 votes -
market profiles
Please give me some ideas. How to build a chart like this?
http://www.ranchodinero.com/wp-content/uploads/2012/04/ES-Weekly-TPO-Profiles.png
Is there any sample?
1 vote -
printing Chart with Scroll Bar
Do we have an option to print the complete chart instead of the just the part of the chart in view when using a scroll bar
Example: http://jsfiddle.net/gopinaghr/kUSyF/293/
I would like to print complete chart using the print button.3 votes -
1 vote
-
Support of EDGE web browser in offline export
Currently, there is no offline export for the new Microsoft EDGE web browser and it would be great to have this web browser also supported.
3 votes -
long label
Ellipsis on last available line of wrapped multi line long labels.
Currently we have ellipsis on first line or multiple lines with no ellipsis. The ides is to have both in case there is space for multiple lines, but still not enough space to show a long label.
6 votes -
tooltips for legends
tool tips for legends will be helpful
3 votes -
Shared Tooltip (Against Y axis)
I'd like to be able to have a shared tool-tip use the y-axis value to group by and show the x-axis values shared for that y-value. This comes up when depicting a percentile chart with 1-100th percentile on the y-axis (as is traditional) . I could not find a way to do it.
1 vote -
1 vote
-
chord diagram
A chord diagram or an extended diagram is basically used to show data flow between multiple entities. We can have a circular chord diagram or an extended one.
Currently we are achieving it through d3.js, but that requires lot of complex coding18 votesThanks for your suggestion, we do have this study that includes a subset of chord diagrams: http://jsfiddle.net/gh/get/library/pure/highcharts/highcharts/tree/samples/highcharts/studies/circle-relation/
-
Hiding empty columns
If you hide all bars in a column that is in the center of things, it will not be hidden currently. I suggest that this is made possible.
7 votes
- Don't see your idea?