1084 results found
-
Tap&Drag zooming for line charts on touch input devices
Currently users on mobile devices have to zoom by pinching. However, this method of zooming is very inaccurate and in a stock data scenario rarely does what the user intended.
Add an option to change pinch-zoom for tap&drag zoom that basically simulates how it works with a mouse on desktop. Zooming would occur by tapping and dragging the finger across the screen. Panning can be achieved with a scroll bar if needed.
6 votes -
1 vote
-
Add minPointLength for CLOSE to zero values but not for value exactly 0
We have bar and column charts with data of very distant values. Like 0.5 next to 8000000. So highcharts scales itself in the way that this small values are invisible without zooming.
There is an attribute minPointLength (http://api.highcharts.com/highcharts#plotOptions.column.minPointLength) that makes such samll values visible. But the problem is that value 0 is also rendered then. So we would like to have. minPointLenght behavior for close to zero values but NOT for value 0.48 votes -
add events to axis labels
there should be standard events like mouseOut, mouseOver, click , etc. available for axis labels. currently it is possible to do it through custom events plugin, but it is not compatible with latest highcharts
1 voteThe Pointer object has a nice utility that you can use to detect whether a certain class is clicked: http://jsfiddle.net/qcehvqqk/
-
SVG marker symbol sizing by height and width instead of radius
I have a project where I needed to add mean diamonds to a boxplot, and I have a working prototype where the height and width of the marker symbol are used instead of the radius. The marker height needs to stretch or shrink based on a data value instead of being fixed by a radius value. Below is a shim that I wrote that modifies the Series markerAttribs function. Can you take a look at this function and find a way to integrate it into a future release?
Thanks,
Jeremy//Taken (and altered) from highcharts.src.js (v5.0.7) line 17497
Highcharts.Series.prototype.markerAttribs =…1 vote -
KAGI Chart and Point & Figure Chart
Can we have highcharts extension/module which can create kagi chart and point & figure chart similar to http://stockcharts.com/school/doku.php?id=chart_school:chart_analysis:kagi and http://stockcharts.com/freecharts/pnf.php?c=$INDU,P
7 votes -
Provision to add dataLabels (median, min, max) in boxplot
There must be a provision to add labels for max, min, median in the plot itself apart from the hover. While taking print, it would be great of the labels are printed for ease of use.
32 votes -
Horizontal Legend Paging
The legend paging that was implemented works well for vertical legends, but not for horizontal legends. In the case where there are many plots on the same chart, the paging buttons take up too much vertical space on the chart, they should be floated to the left or to the right, or the legend should become a "scrollable" object to avoid this issue.
P.S. Another issue is that the legend has some clipping issues if there are more than 2 or 3 pages.
This can all be seen here:
232 votes -
ignore series for axis scaling
like to be able to tie a series to an axis for display but have it ignored for scaling as long as there is another series available to that axis for scaling.
Series : [ ignoreForScaling : Default false] or maybe
Series : xAxis|yAxis : [ignoreForScaling :Default false]5 votes -
Dynamic description
Currently the chart.description property accepts a string.
If there was a chart.descriptionFormatter or similar property that expected a function. If this function was passed the chart data then it would be fairly trivial to make dynamic descriptions.
This would be fantastic for accessibility too in dynamic cases such as stock charts. Knowing that it is a line chart the developer could easily write a function that could return something along the lines of:
"This is a line chart showing Acme Co's stock price between {startDate} and {endDate}. In that period the price has [risen to|fallen to|remained stable at] ${price}. Volatility…
3 votesThis is a great and simple idea to implement.
-
Huge data export
I have a million data on my chart , that i need to export with help of excel 2010 and above..
Is there any way from high chart, because we are using highchart boost for million data drawing in chart.
4 votes -
feature to drag sku from chart to empty bookmark component(another empty chart)
feature to drag series point and drop in another chart which is empty(like a series bookmark holder)
3 votes -
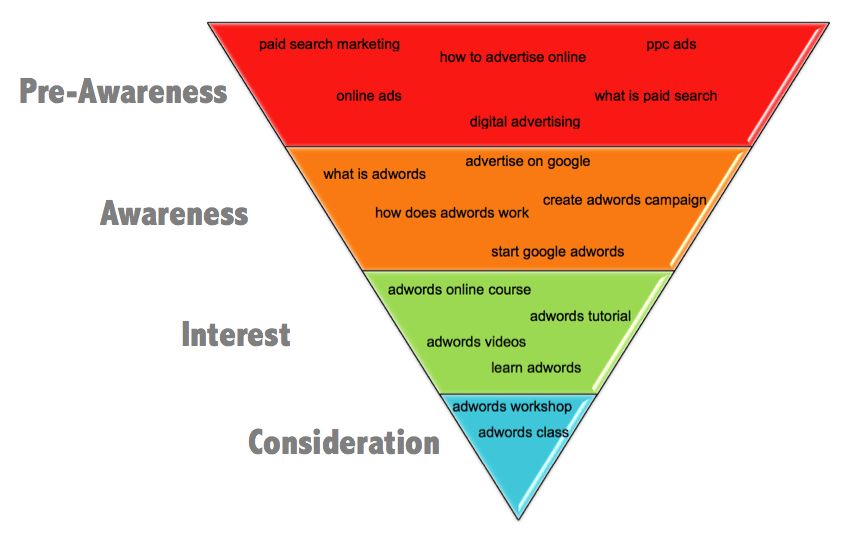
Funnel with fixed height
It would be nice to have an option for the funnel to set a fixed height for each row.
I'm thinking of an separate array with percents. So you can make a upside down pyramid like this:
http://www.searchenginejournal.com/wp-content/uploads/2013/03/image00113.pngSo you set a height for the chart and the config would be [25,25,25,25]
7 votes -
Dynamic labels for treemap
Size of treemap labels autosize according to the size of squares
e.g. http://d3plus.org/examples/advanced/10305148/1 vote -
Drag whole chart to move around, not part of them
Drag whole chart to move around, not part of them.
So it could put to any place by a designer3 votes -
Allow gauge to take negative/positive value, extending from a zero position
http://jsfiddle.net/j99skchd/
This example displays a gauge from -4 to +4. The series data value of 0.5 would ideally make the gauge colour the range from 0 to 0.5.
Correspondingly, a series data value of -0.5 would make the gauge colour the range from -0.5 to 0 (and in the example we would make that a green range).7 votesThanks for the good idea! Implemented in https://github.com/highcharts/highcharts/commit/fa07d08fa93a52f3cf232fb83e089cc01093c889, it will be out with the next release. See live demo at http://jsfiddle.net/highcharts/j99skchd/2/.
-
Pagination facility providing is most important for bar charts
Pagination facility providing is most important for bar charts
3 votesWe don’t have pagination currently, but you can add a scrollbar to the X axis: http://utils.highcharts.local/samples/#view/stock/yaxis/inverted-bar-scrollbar
-
Make categories a valid JSON object.
Make categories a valid JSON object. Much easier to use JSON option SQL Server 2016. See functionality SQL Server 2016 for JSON. I want to set categories in Highcharts like so:
categories: [{"name":"apples"},{"name":"bananas"},{"name":"kiwis"}]
Or something else for 'name'. Now I have to use a trick with XML and STUFF to get it like ["apples", "bananas","kiwis"].
1 vote -
Provide a typescript version for your javascript
Provide a typescript version for your javascript
http://www.typescriptlang.org/77 votesWe are currently in the process of finalizing official TypeScript support.
-
tooltip
Expose mouse move event or a callback to override tooltip visualization with point object and mouse coordinates.
4 votes
- Don't see your idea?