1084 results found
-
pinch zoom for ipad/tablet
I would like to give the user the ability to pinch zoom much like sencha charts
15 votesPinch zooming is being developed for Highcharts 3.0.
-
Short Days
when the %a is used for a dateFormat, the first three letters of the corresponding weekday defined in lang is used.
This is a reasonable default.However there are languages, as German, where the usage is to shorten weekdays with 2 letters only
Could the entries for short days be added to lang
Of course directly using shortened day names works as well
4 votes -
Add range selector to highcharts js
It would be great to have a range selector in highcharts that is the same as the highstocks one, with the draggable handles.
34 votes -
Handle multiple groupings
For example, we currently have a plot that has three layers of groupings
eg. We have a series of data that each point has a sample type, disease state, probe and gene associated with it. We want to move onto highcharts but would need to be able to show the sample type in the label/colour but show the breakdown for the disease state, probe and gene. See below for our current implementation in flot.https://docs.google.com/open?id=0B0Nu-R_YNfgIb0Fidmt1TFd1TU0
I apologise if I can actually already do this - I thought I would ask first before I tried implementing it - I didn't see…
3 votes -
Add "ondblclick"-Option - e.g. for Exporting-Module
What I want to do:
exportButton.onclick = show Menu
exportButton.ondblclick = direct exportThis should actually be possible using jQuery, but I dislike adding Code beside the Highcharts-Object.
117 votesCurrently available only by DOM scripting.
-
add the capability for HighStock to project future growth based on the past data.
If we have a series that over time is always increasing like this one: http://plus.tehk.org it would be nice to be able to ask highstock to plot a dotted line of future growth based on the average of all data for the period of data displayed. For instance, I would like to know when my count of G+ users will hit 1 billion. I could add this projected point to HighStock js and it would plot out the estimated growth out to this date.
4 votes -
Improve series highlight on legend hover event (by dimming other series)
It would be useful if you could improve the series line highlight (or equivalent on other chart type) on legend hover event.
Following what is currently achieved on hover state by default, where it highlights the series line by adding line width, it should be possible to dim or gray out the other line series in the graph.
This can be easily done by using events on legend items hovering: http://jsfiddle.net/vitorbarbosa/qpByN/
however, it would be nice if it was implemented natively and for other chart types.17 votesHere’s a plugin that works with columns as well: http://jsfiddle.net/highcharts/Ha3Wr/
It works by setting the opacity on the group element. I don’t expect it to work in legacy IE though.
-
Provide the option to let piecharts show the larger segments on top
Reading a pie chart is like reading a clock. It's most effective to place the largest segment at 12 o'clock (as it does now). The best way to order the rest of the segments is to place the second biggest slice at 12 o'clock on the left; the rest would follow counterclockwise.
1 voteThanks for your suggestion. For now, you can just sort your data by value before adding it to the chart.
-
Enable drilldown on x axis click event same has clicking a column to drill down
more information here ..
http://highslide.com/forum/viewtopic.php?f=9&t=20657
like this column drill down chart http://jsfiddle.net/Fusher/NULTY/
i would like to have the x axis related to an an series in a column drilldown have the same effect has clicking on column . to drill down.
it would be very usefull when data is plotted on negative side too .
6 votes -
Support "dblclick" event
Please support "dblclick" event for chart, series, and point.
18 votes -
Ability to persist tooltip post mouse leave.
Would like the ability to keep the tooltip shown after the users mouse has left the chart. Pretty easy to add.
Add option tooltip.sticky
Current 3.2.0.
Line: 1613. Add sticky: false.
Line: 8672. Add && !chart.options.tooltip.sticky.
Line: 8618. Wrap with if statement (!chart.options.tooltip.sticky).23 votes -
Have percentage position instead of fixed position for labels for different screen resolution
i would be nice option to have if highcharts has option for html label position based on screen percentage instead of fixed position in pixels. it would help a lot for different screen resolution
14 votes -
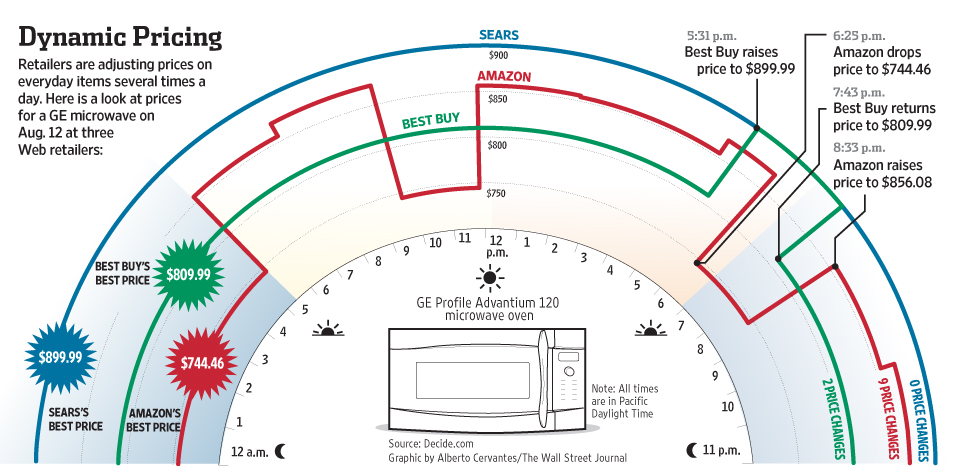
Radial value-time chart
Example: http://www.ritholtz.com/blog/wp-content/uploads/2012/09/P1-BH923_PRICE_G_20120904184802.jpg
Settings for AM, PM, 24H, partial day etc.
4 votes -
chart within tooltips
Is possible to display a chart in the tooltips ?
Like a drilldown chart which is shown at tooltips.
I have try a few simple solution with it :
1. I'm set useHTML option to TRUE, and applying <iframe> syntax. So basically, i make 2 chart.
2. I'm set useHTML option to TRUE, and applying <img> syntax. So i have 1 Chart & 1 Image.What I dislike from my method :
Method 1. I cannot customize tooltips size.
Method 2. I will have a chart image, not an interactive chart1 vote -
Exporting charts just by right clicking on them
Hi
I would like to suggest a small improvement concerning exporting. At the moment, user that wants to save a highchart has to click on a download icon and choose an option from a dropdown.
A small but great improvement would be to do the same, just by right-clicking on a chart.You just right click on a chart -> save as -> desired format and voila!
I am not sure if sucha feature is possible to implement, but it would be neat to have this! :)22 votesI did an attempt at http://jsfiddle.net/highcharts/spaa2he9/, but it is quite unstable. Maybe it can serve as a starting point for you to figure out how to enable it.
-
2 votes
-
I suggest you a new feature for "donut charts"
I suggest you a new feature for "donut charts" (with 2 or more circles, like "browser" and "version" in your example).
I have a real need in this feature. What is it?
When user click on one label at the legend (which has 2 labels: "browser" and "version") this label and circle at the chart display none.
The other data at the chart (i mean the next circles, more outlying) must regroup.
So, if there are 2 same "1.1" version, with "5%" and "7%" at the second circle, after the regroup it must display "12%" in one sector.
I realy…9 votes -
dynamic/infinite threshold for area charts
I have a need to display an area above (or below for reversed y-axis) a line. I can certainly specify a threshold above the highest value in the series, however this breaks the yAxis ability to dynamically pick the maximum end of the range based on the data. So I suggest either (a) have an option for the yAxis to ignore the threshold when dynamically choosing the min/max of the range, or (b) having special "positive infinity" and "negative infinity" values for the threshold that would of course be ignored by the yAxis ranging.
Thanks!
16 votes -
Explicit support for drill-down Ajax interactive data zooming
I have an extremely large dataset (once-a-second measurements extending over several years) that I'd like to be able to zoom in (and out) interactively with the Highstock navigator as well as direct selection with the mouse.
I think I have finally managed to piece together a somewhat stable solution by using the rather under-documented setExtremes event. However, some slight instabilities remain, mainly due to the fact that the setData method appears to itself trigger the setExtremes event sometimes. In addition, my dataset is discontiguous (has many gaps) and Highchart seems to like to shrink the limits of the selected data…
19 votes -
axis option minorTickCount
Currently if minorTickInterval is set to 'auto' then the calculation to determine the minor tick interval does a divide-by-5 on the regular tick interval. I would like an option to change this magic number 5 to something else.
1 vote
- Don't see your idea?