1084 results found
-
Auto scale large data sets
Hi
The ability to provide a large dataset and then have highcharts auto-scale it to fit the screen and corresponding zoom level17 votes -
Using custom shapes like callout box for tooltips
Please provide facility in Api to use shapes like callout box other than the default rectangle shape for tooltips.
7 votesActually this is possible today, you just have to write the symbol path, which is quite complicated. Here’s a sample that supports pointers on the right and left side. Rounded corners not yet supported:
-
microcharts
Microcharts for dashboards like Bonavista Systems
6 votes -
Java Library
Would be awesome to have a java library to create your fancy charts!!!
10 votes -
Zk Grails support
If we can use it (requires Zk Grails support), we will license it.
3 votes -
3 votes
-
allow user to pick a graph point and change it.
Click a point to edit, change its location on selected axis.
1 vote -
Matrix charts
I would like to submit a matrix chart project witch could allow us to draw chart in 2 dimension.
14 votes -
tootilp hide/visible per point
tooltip hide/visible per point
3 votes -
Improve Column handling of negative values
Plotoptions on columns with negative values does not place itself correctly (offset seems to be added and not subtracted), also seems that formatter functions doesn't get run.
Also could you add a positiv and negative color list.
4 votes -
Pie stacking percent
As stacked column stacking=>percent, pie sometimes need this feature, typically for " answer to a question " " yes, no, no answer ", we may see % of yes using people who have answered !
4 votes -
SPIE Chart
Dual PIE charts with 2 sets of data with both Radius and slice changing. As mentioned here :
http://eagereyes.org/criticism/cost-of-a-sick-chart2 votes -
3 votes
-
Image fallback for non-javascript environments
I imagine this would be something similar to Google Static Maps, where a chart would be displayed via an img tag. This would be useful as a fallback for browsers with JavaScript disabled, or in dynamically created downloadable documents (like PDFs)
10 votes -
Add the option of using a flash based SVG viewer
To speed up drawing of charts on IE <9 maybe add support for http://code.google.com/p/svgweb/ then IE<9 gets flash rendering if flash is available or VML if not.
6 votes -
splinexy
It will be good to see spline xy functionality in Highcharts. Its very important thing in math graphs. Thank You!
3 votes -
Restore "target" option in the "credits" configuration
It would be most useful to restore the "target" option in the "credits" configuration so that when the user clicks on the credit text (usually in the lower right angle of the graph), the link can be opened in a new page instead of the current one.
22 votesHere’s a small plugin that you can use that alters the click handler to simulate a HTML anchor click including a target: http://jsfiddle.net/highcharts/ud795/
-
Scatter plot improvements
Please, consider these two features :
- allows to set the radius proportional to a third data point variable (z),
- allows to connect some markers by line segments (this will illustrate the fact a given value is related to another one)11 votes -
10 votes
-
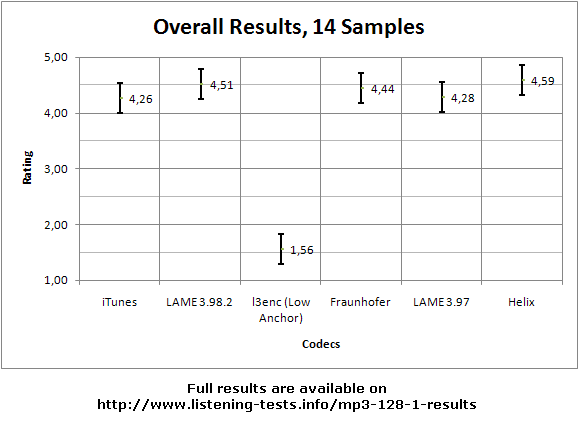
Confidence bars
It would be great if you added support for drawing confidence bars so one could make something like this: http://listening-tests.hydrogenaudio.org/sebastian/mp3-128-1/results.png
4 votes
- Don't see your idea?