1084 results found
-
save
save users charts in database for using later. and ability to add points and save them
3 votes -
Downloading hint (such as gif anaimation during Highcharts javascript is downloading)
When data is huge, user may only see a blank space for quite some time. It will be much better, if there is an animation showing that smoething is still loading
3 votes -
dynamic/infinite threshold for area charts
I have a need to display an area above (or below for reversed y-axis) a line. I can certainly specify a threshold above the highest value in the series, however this breaks the yAxis ability to dynamically pick the maximum end of the range based on the data. So I suggest either (a) have an option for the yAxis to ignore the threshold when dynamically choosing the min/max of the range, or (b) having special "positive infinity" and "negative infinity" values for the threshold that would of course be ignored by the yAxis ranging.
Thanks!
16 votes -
Provide the option to let piecharts show the larger segments on top
Reading a pie chart is like reading a clock. It's most effective to place the largest segment at 12 o'clock (as it does now). The best way to order the rest of the segments is to place the second biggest slice at 12 o'clock on the left; the rest would follow counterclockwise.
1 voteThanks for your suggestion. For now, you can just sort your data by value before adding it to the chart.
-
outline border to stacked column bar
Instead of individual column border in stacked column.Can we apply one Outer border to Column in a single Stack . Here you can see : http://snag.gy/7KqAY.jpg.
15 votes -
Short Days
when the %a is used for a dateFormat, the first three letters of the corresponding weekday defined in lang is used.
This is a reasonable default.However there are languages, as German, where the usage is to shorten weekdays with 2 letters only
Could the entries for short days be added to lang
Of course directly using shortened day names works as well
4 votes -
Trellis Charts like http://peltiertech.com/WordPress/trellis-plot-alternative-to-stacked-bar-chart/
Trellis Charts like http://peltiertech.com/WordPress/trellis-plot-alternative-to-stacked-bar-chart/
44 votesYou can create Trellis charts in Highcharts by adding multiple charts side-by-side or underneath each other, for example inside a table or floating divs. See http://jsfiddle.net/highcharts/VqruM/.
-
Dynamic histogram charts
I would love to see interactive histogram charts. Ideally I would pass a single series of data to the chart, along with a default number of bins. Then the user would be able to change the number of bins and the data would be re-binned and the chart re-drawn. Bin labels would be need to be regenerated automatically as well, either from the range of each bin, or its center-point.
An example:
Series: { data: [1,2,1,2,1,2,3,3,4,4,4,4,4] }
Histogram: { defaultBins: 2}would become:
xAxis: { Categories: [ "1-2", "3-4"] }
Series: { Date: [6, 7]}Then if the user changed…
25 votesSee our official histogram demo at http://www.highcharts.com/demo/combo-histogram
-
chart within tooltips
Is possible to display a chart in the tooltips ?
Like a drilldown chart which is shown at tooltips.
I have try a few simple solution with it :
1. I'm set useHTML option to TRUE, and applying <iframe> syntax. So basically, i make 2 chart.
2. I'm set useHTML option to TRUE, and applying <img> syntax. So i have 1 Chart & 1 Image.What I dislike from my method :
Method 1. I cannot customize tooltips size.
Method 2. I will have a chart image, not an interactive chart1 vote -
Enable drilldown on x axis click event same has clicking a column to drill down
more information here ..
http://highslide.com/forum/viewtopic.php?f=9&t=20657
like this column drill down chart http://jsfiddle.net/Fusher/NULTY/
i would like to have the x axis related to an an series in a column drilldown have the same effect has clicking on column . to drill down.
it would be very usefull when data is plotted on negative side too .
6 votes -
I suggest you a new feature for "donut charts"
I suggest you a new feature for "donut charts" (with 2 or more circles, like "browser" and "version" in your example).
I have a real need in this feature. What is it?
When user click on one label at the legend (which has 2 labels: "browser" and "version") this label and circle at the chart display none.
The other data at the chart (i mean the next circles, more outlying) must regroup.
So, if there are 2 same "1.1" version, with "5%" and "7%" at the second circle, after the regroup it must display "12%" in one sector.
I realy…9 votes -
Support Android 2 on HighStock
Support android 2 for highstock or gracefully degrade minimally so that something is viewable.
http://www.highcharts.com/documentation/compatibility#android2
11 votes -
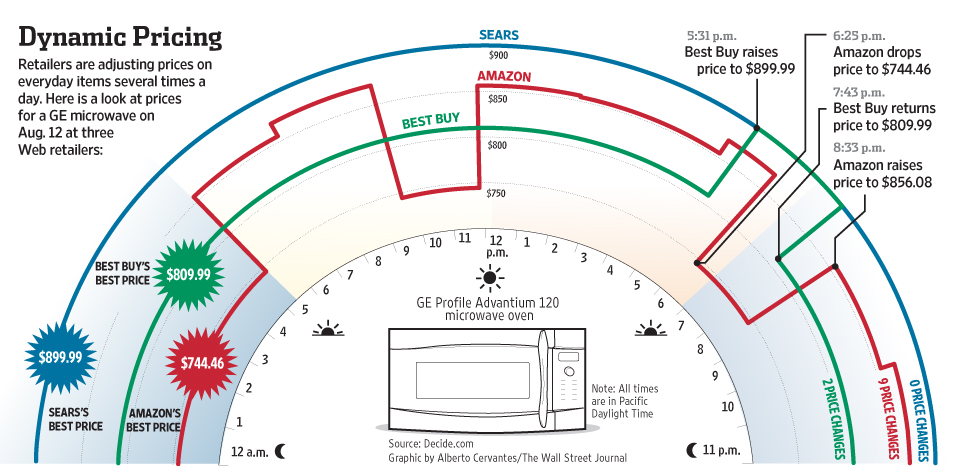
Radial value-time chart
Example: http://www.ritholtz.com/blog/wp-content/uploads/2012/09/P1-BH923_PRICE_G_20120904184802.jpg
Settings for AM, PM, 24H, partial day etc.
4 votes -
Show only changed axis labels
Given following x- or y-axis categories.
["Jan", "Jan", "Jan", "Feb", "Feb", "Mar", "Mar", "Mar", "Mar", "May"]It would be great if we could show only changed labels (like a more advanced "labels.step" option). Like follows:
|
|
|______________________
|Jan|||Feb||Mar||||May|3 votes -
Add footnote textbox immediately below chart.
I have several charts for which I need both subtitles and footnotes to clarify/explain the presentation of data (and I always use credits). When displaying on the web it is easy enough to add a paragraph under the chart, however I also need this footnote when exporting the chart. I would envision a simple text box above the credits section.
There is a similar suggestion that was closed with the suggestion to use subtitles ( http://jsfiddle.net/sGv32/5/ ), but this suggestion will obviously not work if subtitles are already being used. Also, in Chrome, the chart tries to display below the…16 votesHere’s an example of how to add a responsive and exportable text box programmatically: http://jsfiddle.net/highcharts/WwPFN/
-
Allow an array of dataLabel colours
This would mean if the user had specified a number of different colours for the chart, we could then match the colours of the dataLabels, either to be the same if we wanted, or to invert if we want to put the labels over the bars, columns, slices etc.
So if our first bar was dark we could set the first label to be white, and if the second was light, the second label would be dark.4 votes -
2 votes
-
Let Highcharts.dateFormat support week numbers.
%U, %V and %W on php strftime
35 votes -
The hole percentage of doughnut chart should be based on diameter of doughnut rather than plot area.
Now the hole percentage of doughnut chart is based on plot area, but the diameter percentage of doughnut chart is also based on plot area, so user might set same percent value for hole size and diameter and the doughnut will be rendered as unexpected result, here is the detail http://highslide.com/forum/viewtopic.php?f=9&t=19252.
3 votes -
Set off negative against positive values in stacked charts
It should be possible to sum up negative and positive values in the same stack (like excel does for area charts by default).
Currently positive and negative values are stacked seperately above and below the x-axis. To keep BC and keep the old behaviour as well a new stacking mode should be added IMHO.
22 votesThis is the corresponding GitHub issue: https://github.com/highslide-software/highcharts.com/issues/1059
- Don't see your idea?