1073 results found
-
Hide dataLabels when they cannot fit in column/bar
When you have a dataLabels displayed on bars/columns that are all low value and close to one another, the dataLabels become merged and unreadable.
I added some code in the alignDataLabel function that hides the dataLabel if it cannot fit inside the column/bar it is to be displayed in. When the column/bar size changes by either resizing the window or by turning off some series the dataLabel becomes visible, or invisible if made smaller.
Here is a gallery demonstrating the changes: http://imgur.com/a/Qn6ui
The changes are simply adding the following code to the alignDataLabel function:
…if ((point.series.options.stacking != null && point.series.options.type12 votes -
Dynamically change the menu items of the Export menu
Add the ability to dynamically make changes to the MenuItems located in the chart.options.exporting.buttons.contextButton, without having to destroy/recreate the chart, similar to setTitle() and addSeries() ability to dynamically change the titles and data, respectively.
Currently, one can access the array of MenuItems, and one can make changes to the objects themselves, specifically the onclick() function; the function itself is updated.
However, the text/styling, which may also need to be updated, is NOT reflected in the chart unless you destroy and recreate the chart.
Please add some function, perhaps that may accept an array of menuItem objects, that will re-render just…
12 votes -
Manage multiple pie series dinamically
Would love highcharts to be smart-enough to be able to manage multiple pie series in a smart/dynamic way
This would include
- being able to handle multiple series on pies this should be handled automagically, same way other type of charts does (bars, columns, ...)
this would include rendering the diferent series in the given container, making its representation fluid.
currently the JS programmer needs to specify the centre of the pie, and the size of it, being aware of the given space, leading to some calculations that are difficult to handle when leading with a dynamic number of data/series.parametrization…
12 votes -
genealogy family tree charts with multiple parents,i want to build family structure dynamically
genealogy family tree charts with multiple parents,i want to build family structure dynamically
12 votes -
Official NuGet package
.. so we don't have to depend on unreliable, out-of-date packages.
This shouldn't take too much effort.Bonus: follow the ASP.NET bundle file name conventions
*.js -> normal files for debugging
*.min.js -> minified12 votes -
Beeswarm plot (aka. strip chart / dot plot)
It would be great to have a simple dot plot in HighCharts. Categorical data with a single value, displayed with sideways jitter to prevent dots overlapping. The advantage of this plot is that it is great at showing distributions. It's also simple to interpret and good with large numbers of data points.
There are several R packages that do this (beeswarm being the main one). See http://www.cbs.dtu.dk/~eklund/beeswarm/
Bonus points for dealing with overlapping plots intelligently (see beewarm package 'corral' options). Perhaps automatic point sizing?
12 votes -
Drilling down to City Level
I want highmaps to drilldown locations to city level specially for USA.
12 votes -
Apply negative fill color if area range values are crossed
The original area range plot:
https://drive.google.com/open?id=0BxTJinjfcZ1uaTZJQVRoSkY0WEEApplied negative fill color in the crossed area:
https://drive.google.com/open?id=0BxTJinjfcZ1uZ1VlOEZxWDBLb0E12 votesThanks for your suggestion!
-
Official Vue.js Wrapper
Hi, It's excited to hear that you are created Highcharts official React, Angular wrapper, and do you have any plan to create Vue.js Wrapper ?
more information about Vue.js
Official Website: https://www.vuejs.com
vue Highcharts wrapper : https://github.com/weizhenye/vue-highchart12 votesThanks for your request! Currently we don’t have a plan for a Vue wrapper, but we will consider this if the demand is high.
-
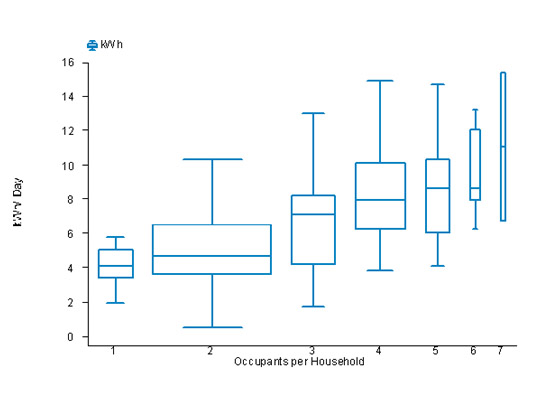
Variable widths for Box Plots
Variable widths for box plots is a popular convention (see https://en.wikipedia.org/wiki/Box_plot#Variations). Variable width box plots illustrate the size of each group whose data is being plotted by making the width of the box proportional to the size of the group. For example:
http://www.fsec.ucf.edu/en/publications/html/FSEC-PF-369-02/images/pf369-10a.jpgSo, there should be a way to provide pointWidth for each data point of box plot. Also, this feature should work seamlessly with multiple series.
Issue has already been filed to Github: https://github.com/highcharts/highcharts/issues/5441
12 votes -
Highcharts wordcloud: Group words in sections and show words having maximum weight in each category with relative font sizes
https://www.anychart.com/products/anychart/gallery/Tag_Cloud/State_of_the_Union_Address_Most_Used_Words.php
Refer the image in the above link. The image shows words grouped in 3 categories: Barack Obama, George Bush and Ronald Reagan. Each of these categories have a word with maximum frequency – I (70%), will (49%) and will (65%) respectively. Thus the font sizes of maximum frequency words are shown relatively.
I have tried following 3 examples:
1) Render three wordclouds in a one chart: jsfiddle.net/znm6f89r/8 - but still, word weight is based on the size within the series.
2) Define custom placement strategy: jsfiddle.net/znm6f89r/28 - but labels may not be within the column.
3) Using 3 series…12 votes -
12 votes
-
Add tooltip to highstock navigator
It would be great to have a tooltip while you are dragging the navigator in a highstock chart so you see your currently selected date.
Previously there was a plugin (https://www.highcharts.com/products/plugin-registry/single/44/Navigator%20tooltips) but that does not support the current Highcharts version
12 votes -
bignumber highcharts
Possibility to use Highcharts with bignumber.js
12 votes -
Zoom in/Out in network graph
Network graph is not supporting zoom in/out. , zoom = xy will only work in graph which have axis(x and y).
Suppose user is having 100+ nodes, then its very difficult to understand the nodes. So if zoom in /out like in google map, then it will be very easy to zoom and find the particular node and perform the action.12 votes -
Fill between lines with colour depending on order
I would like to fill a space between two lines that generally move up and down, but sometimes one is above the other, and sometimes the other way. And I'd like the fill colour to reflect which line is on top.
Take the following as an example.
https://jsfiddle.net/xczdfkjf/1/
Where the lower and upper ends of the range cross over, between 6 Jul and 7 Jul, I'd like the fill colour to change.
I originally posted this question here back in 2016, and have seen similar questions/requests, but still in 2021 it is not possible :( https://stackoverflow.com/q/41292433/4070848
The answer in the…
12 votes -
Automatic creation of "Others"-Series
Every Series with a sum of its values less than a defined threshold will be put automatically in a Series call "Others".
11 votes -
Scatter plot improvements
Please, consider these two features :
- allows to set the radius proportional to a third data point variable (z),
- allows to connect some markers by line segments (this will illustrate the fact a given value is related to another one)11 votes -
Read data from xml
Give the opportunity to pass an url of an xml to highcharts with the datas for the chart.
The datas will be the categories of an axis and the data of a series.
Something like this:
<datas>
<data>
<series>0,1,2,...</series>
<categories>0,1,2,...</categories>
</data>
<data>
<series>3,4,5,...</series>
<categories>1,2,3,...</categories>
</data>
</datas>
This feature would help the implementation of libraries with other programming languages like php, asp, asp.net, ...
The programmer should not implement functions in js to interpret the data, but simply pass the URL of the XML and highcharts will parsing it.11 votes -
11 votes
- Don't see your idea?