1084 results found
-
do you have india distric level map
do you have india distric level map
1 vote -
borderRadius for specific datapoints
To give an example, if you have a stacked column chart with two columns, but only one column has data for both series, it would be good to be able to round the corners (currently using the rounded-corners.js plugin) of whichever data point is on top of the stacked column. Currently, borderWidth and borderColor can be specified for individual points. https://api.highcharts.com/highcharts/series.column.data.borderColor
As you can see in the documentation, there is no borderRadius option.1 vote -
Extend to support end-users working in PowerBI
Would be extremely helpful and would widen the horizon of potential users if you could implement a solution which allows end users of Power BI to utilize Highcharts visuals as part of their reports without the need for any programming experience.
Preferably through putting your charts in the Power BI marketing place.3 votes -
Add 'Cumulative Sum' type series
Given the amount of development geared towards highcharts as a financial charting library, it's a little surprising that there is no 'cumulative sum' series type.
The user can take the cumulative sum before a series is added... but as soon as the date range is changed, the series should re-calculate the cumulative sum. Implementing it requires wrapping/extending no less than 6 highcharts functions, and I'm sure I'll continue to come across more.1 voteStarted, you can follow the progress on our GitHub: https://github.com/highcharts/highcharts/issues/15361
-
stock
I suggest to add the option to compare each point.y with another poin.y at the same point.x (for example, percent with respect at the first serie in each point), not just compare with the first value in the serie, for stock charting.
1 vote -
1 vote
-
es posible mostrar horas para ver tendencias de una serie temporal en un eje Y a lo largo de los días en un eje X?
Representación de horas en un eje Y en una serie temporal.
1 vote -
Display Highchart As image
I want to display highchart as image so if data come from api chart in image changes according to that .
1 vote -
Multiple Series with shared tool tip for a Line Chart to show only nearest points that were plotted on hover over
Hi Highchart Team,
We have a line chart of multiple series with shared tool tip to show custom logic on it. Now, requirement is that, we need to highlight only marked enabled points w.r.t mouse hover over location.
To achieve the same, I have used shared: true along with formatter. But, it doesn't seem to be working. Can some one please look into this issue and let us know your inputs.
http://jsfiddle.net/Anvesh1992/86smc9Lo/
Regards,
Anvesh A.3 votes -
Have a movable marker in line series which will stay on position even if the data is loading dynamically.
A marker like a tooltip but which will stay all the time and can be moved around on a line series chart. This marker should not disappear even if the line series data is updated.
1 vote -
Add tooltip headerFormatter option
I am currently in the middle of a project where I need to format Y values differently per series and the X values need to be converted from timestamps to week numbers.
Right now I'm hacking together a solution based upon feedback in this GitHub issue: https://github.com/highcharts/highcharts/issues/11891
It is not intuitive nor simple. I will work on a PR when time allows.
1 vote -
Replace name "Distrito Federal" with "Mexico City" (mexico changed the name of the subdivision)
Mexico changed the name of Distrito Federal to Mexico City in 2016.
1 vote -
Import Live Data from Google Sheets for Maps in "everviz"
In "everviz", "Connect Google Sheet" is a great feature to "Import live data" to the charts.
This is not available for the "Maps". I will appreciate it if you provide such an option for the maps.
Thank you in advance.
1 vote -
Legend Icon size is same as Marker size, Should have it's size configurable
I do not see any way to change the size of legend icon. I am rendering two series of scatter plot having million points and set marker radius size to 0.1. Plot looks great. But the legend icon of radius 0.1 is very tiny hardly we can observe it on the UI. I would like only legend icon to be in default state i.e. of radius 4. In this way user will be able to understand which color goes for which series.
3 votes -
1 vote
-
Highcharts hosted translations / language packs / locale packs
I have searched for Highcharts translations (language packs / locale packs), but haven't found more than short extracts and only for a few languages.
Highcharts states that "Highcharts sports the industry’s most sophisticated accessibility support", and I agree that it has very good accessibility support.
However, in some implementations I have seen the accessibility part is not translated (even though the accessibility module is used), and then it doesn't matter how good support it is if the user doesn't understand English.
To reduce repetitive translation work by companies using Highcharts products I suggest that Highcharts host translations in the Highcharts…
3 votes -
Tooltip option to only show overlapping series in shared tooltip.
The tooltip.shared: true option currently shows the tooltip for all series.
However for charts with many series this is becoming a lot of information. Therefore it would be very handy to add a option which only shows the lines which overlap in the tooltip.
You can see this as a sample for two lines here: https://stackoverflow.com/questions/18988329/highcharts-use-shared-tooltip-only-when-series-overlap
3 votes -
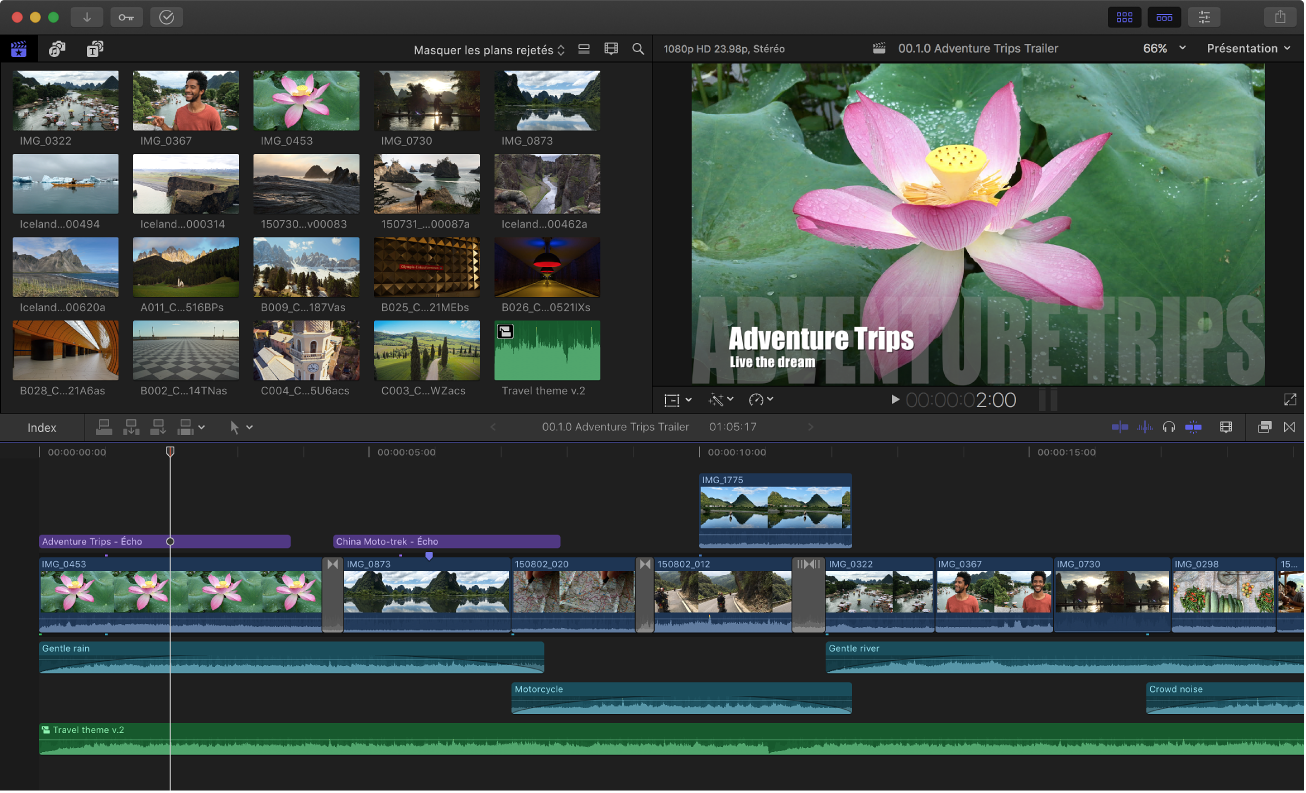
Gantt Player bar
Hello,
A good feature for the gantt will be a player bar like you can see video editor (https://help.apple.com/assets/5B906E570946222769C59847/5B907055680CE21E1ABD0FFD/fr_FR/3586832deaa5d73c6ad2aca436e25c0d.png ).
Thank you
1 vote -
Boxplot zones using median as threshold
For boxplot chart, when setting zones, highcharts uses the high value as threshold.
It could be great to be able to configure highchart to use a different value (median for example)1 vote -
Downloadable Highcharts.NET examples
The Download button in http://dotnet.highcharts.com/Highcharts/Demo page only includes the Highcharts.NET dlls, can you make it to include codes for all the examples charts?
When I copy codes from the Controller Code and View Code into my project, it won't compile. I used Visual Studio 2017 and 2019.
3 votes
- Don't see your idea?