1084 results found
-
New pattern need to be created from the parent circle patterns for intersected data
Hi
New pattern need to be created from the parent circle patterns for intersected data .
Example: If one of the parent circle has vertical line pattern and other parent circle has horizontal line pattern, the intersected part should have pattern that must be the result of both parent circle. In this case it should look like square box (combination of vertical and horizontal circles).1 vote -
can we allow Heatmap Zones to respect colors from colorAxis?
I have a requirement for heatmaps which involves applying a patternObject as a color for zones applied to the x-axis, but I also need the pattern fill to respect the color applied by the colorAxis.dataClasses. Is there currently a way to do this that doesn't involve applying classNames in styled mode?
1 vote -
your map is very old some place are not add eg:in india add telugana and some other state and in this problem many country so update
your map is very old some place are not add eg:in india add telugana and some other state and in this problem many country so update
1 vote -
Dependency wheel labels orientation
can we have Dependency wheel labels orientation like below attached like
https://www.highcharts.com/forum/viewtopic.php?p=151318#p151318
27 votes -
Implement tooltip.split for inverted charts
Could you kindly implement the tooltip.split for inverted charts?
As soon as a chart is inverted, the split of the tooltip no longer works.
Further explanations, if needed: https://www.highcharts.com/forum/viewtopic.php?f=13&t=42933Thanks in advance
6 votes -
Extend Annotations Plot Bands
PlotBands require an axis and two values from/to.
I think can be a good idea to extend some features:1) If to is null band can stretch in positive axis direction
2) If from is null band can stretch in negative in axis direction
3) If to and from are both null plot band fill the chart area4) Plot band can accept also axis2, from2, to2 parameters, if defined, plot band stop in axis2 direction instead of stretch,
Here a demo prepared by mateuszkornecki
https://jsfiddle.net/BlackLabel/z9hxgrd1/Thanks.
marc.1 vote -
Pro / Contra Bar chart
Bar chart showing Pros to the left, Contras to the right and in between the items as text .
See png example here:
1 vote -
VennDiagram
I need no default datalabel for venndiagram. Kindly reply with solution as early as possible.
1 vote -
Provide control over X axis point in dataGroupng
Grouped points are aligned to the left of the group by default when dataGrouping is applied.
smoothedoption allows the data to be shifted to the middle of the group.Would be great to have option to get grouped points with X coordinate of rhe most right point of the group.
15 votes -
table chart in drilldown levels
when i click the bar it goes to second level in second level i have to shown a table chart
6 votes -
Multiple drilldown nodes
Hi Team,
Can you please help me on below requirements :
When I click on the nested node(series) it is displaying a nested node drill down, and all the nested node should appear child nested and child to another nested child and so on….
I mean there shouldn’t be any limit for generating new node(series), and also It should be stoppable if required.
1 vote -
Timeline chart
Can we change linecolor for timeline chart from specific Point
1 vote -
I would like to request to provide high maps with street view its one of most important feature in maps where customers are in need
We are using highcharts for one of our project licensed version but we need Street view High Maps. Could you please help us with street view maps.
4 votes -
Zoom in/Out in network graph
Network graph is not supporting zoom in/out. , zoom = xy will only work in graph which have axis(x and y).
Suppose user is having 100+ nodes, then its very difficult to understand the nodes. So if zoom in /out like in google map, then it will be very easy to zoom and find the particular node and perform the action.12 votes -
1 vote
-
plotBands Labels have option to be hidden when no space, specially in xAxis
plotBands Labels right now if there is no any space (for example: horizontally), specially in highstock 7.2.0
will be shown out of width of the rectangle.so it will be better we have an option and by defualt be on that make them hidden when no space, specially in xAxis.
1 voteThanks for your request!
You can currently set a fixed width for the label, but it doesn’t scale though: http://jsfiddle.net/highcharts/sr30L4en/.
In order to implement this, the `style.width` would have to be dynamically set to the plot band width.
-
1 vote
-
highstock Measure min-max performance
Hallo team, in highstock you have "measure" feature that give me MIN,MAX,AVERAGE,BINS.
Would me more interesting for stock chart to have % difference from min to max or max to min if i measure downward.
is very simple calculation, could you maybe evauate this?i ask to have:
MIN
MAX
AVG
BINS
%+ (or %-)vould be also great if measurement feature will have magnet that can be anchor to min/max.
Is not possible to load here one picture, but i hope you understood well. I also opened ticket with picture: #2116 Measure GUI
1 vote -
enable resize option for annotation labels shape
Expected behaviour
Currently we have annotations label shapes are like this
Actual behaviour
I need the annotations labels to respond to resize option , that html provides like this
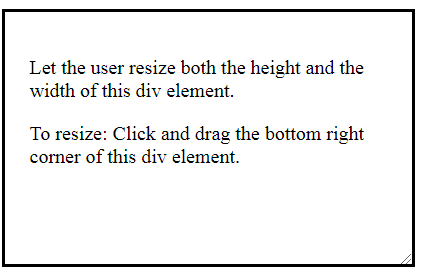Could you please help out in achieving this ?
2 votes -
Can you update the api to support connecting lines between each layer and corresponding value in 3D funnel?
In the funnel 3D diagram, when the values of layers differ too much, the layers with the smaller value is extremely hard to see in the funnel diagram. Can you update the api to support connecting lines between each layer and corresponding value?
1 vote
- Don't see your idea?