1084 results found
-
Matrix charts
I would like to submit a matrix chart project witch could allow us to draw chart in 2 dimension.
14 votes -
Add the option of using a flash based SVG viewer
To speed up drawing of charts on IE <9 maybe add support for http://code.google.com/p/svgweb/ then IE<9 gets flash rendering if flash is available or VML if not.
6 votes -
Improve Column handling of negative values
Plotoptions on columns with negative values does not place itself correctly (offset seems to be added and not subtracted), also seems that formatter functions doesn't get run.
Also could you add a positiv and negative color list.
4 votes -
Add Custom Buttons
Include options to set up custom buttons with call-backs to perform certain functionality.
For example, I would love to be able to have a button next to the current print and export buttons that would be used for help/information about the chart.
31 votesHere’s how you do that: http://jsfiddle.net/highcharts/2F4pJ/.
It has always been around, but perhaps we need to document this more clearly.
-
Support for contextmenu event
Please add support for contextmenu event handlers, or mousedown/mouseup/click events which are captured, to be able to prevent default browser right-click popup menu.
It would be useful to have an ability to show custom menu on different parts of chart (slice/series/point/legend etc.) with according info respectively.111 votesI’ve tried to modify Joe’s patch into a plugin so that it can run without modifying Highcharts itself. The result can be seen at http://jsfiddle.net/highcharts/c42Ms/.
I didn’t have time right now to check across browsers, but I’m open for suggestions for improvements.
-
Zoomable chart - Chart reset by double click to top of chart.
Zoomable chart - Chart reset by double click to top of chart.
1 vote -
Programmatic line chart selection ( http://highslide.com/forum/viewtopic.php?f=9&t=8769 )
Allow programmatic selection of a line/lines on a line chart, to allow them to be made visibly distinctive from other lines. (Use different formatting).
Discussion as to why it is required is here:
http://highslide.com/forum/viewtopic.php?f=9&t=87693 votes -
Image fallback for non-javascript environments
I imagine this would be something similar to Google Static Maps, where a chart would be displayed via an img tag. This would be useful as a fallback for browsers with JavaScript disabled, or in dynamically created downloadable documents (like PDFs)
10 votes -
have options for pie charts with single values
When a pie chart has only one item, a white line appears (the border). This is easily fixed by specifying a borderWidth of 0. But on hover, the line reappears. It'd be nice to be able to disable that border on hover as well
2 votes -
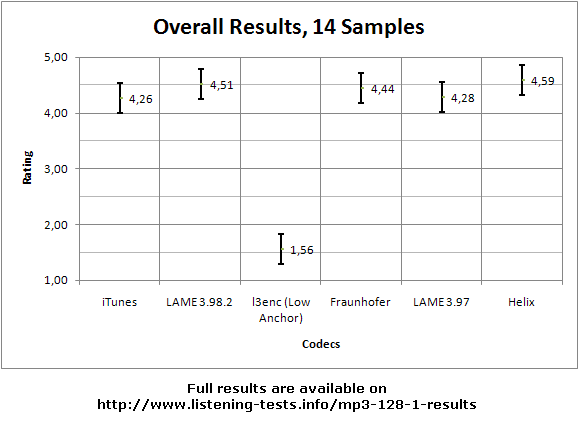
Confidence bars
It would be great if you added support for drawing confidence bars so one could make something like this: http://listening-tests.hydrogenaudio.org/sebastian/mp3-128-1/results.png
4 votes -
Support amination of Area charts
Animation of Area charts does not work in v2.1.1.
See: https://github.com/highslide-software/highcharts.com/issues/issue/169/#comment_631931
9 votes -
DataGrid with Hscroll moveVscroll move
Create datagrid but vscroll move fields move Hscroll move Field lock
3 votes -
10 votes
-
Hold option + click on legend item to disable all other data. (Like Photoshop hide all other layers)
6 votes -
A chart that uses 3D cristal recipients shapes instead 3D bars
For example test tubes graduated with different fill liquids and quantity, or any other shape, this is helpful for formulas inventory
3 votes -
Predefined set of lineargradients
If define global.lineargradient, then switch lineargradient on. Also I hope highcharts has it own set of default colorscheme for gradient which I don't need to worry about.
2 votes -
Remove div after close (clickable points)
I propose to remove div after closure (div created by clickable points).
In highslide-full.min.js:2932 to afterClose function i've added:
hs.expanders[this.key].content.parentNode.parentNode.removeChild(hs.expanders[this.key].content.parentNode);this solutin will be very helpfull
6 votes -
Scatter plot improvements
Please, consider these two features :
- allows to set the radius proportional to a third data point variable (z),
- allows to connect some markers by line segments (this will illustrate the fact a given value is related to another one)11 votes -
Restore "target" option in the "credits" configuration
It would be most useful to restore the "target" option in the "credits" configuration so that when the user clicks on the credit text (usually in the lower right angle of the graph), the link can be opened in a new page instead of the current one.
22 votesHere’s a small plugin that you can use that alters the click handler to simulate a HTML anchor click including a target: http://jsfiddle.net/highcharts/ud795/
-
Static image rendering for performance
The dynamic SVG plots could be replaced by a static image of the plots, similar to how the exported PNG looks. The choice between dynamic and static could be made at runtime based on the size of the dataset.
I'm generating scatter plots based on data from a database. The plots looks great, however the performance gets to be a probably when the plot has more than 1000 points.
18 votes
- Don't see your idea?