1075 results found
-
Candlestick charts built from intraday tick data
The candlestick stock chart requires data in the format of OHLC. For intraday candlesticks, it would be easier to feed the raw tick by tick data and have the chart figure out the candles based on the current data grouping.
24 votes -
Custom approximation function
I would like to have an approximation function in which we can access all the information from the points instead of just the y values. This allows me to not only decide how to group but also an ability to capture information from all the points into the grouped point.
24 votesAs of the next release, we have implemented a hook for getting the raw data for data grouping. See http://jsfiddle.net/xfLLr03a/.
-
Bar/Column Stacked Chart Labels like Pie Chart?
It would be nice if it is possible to create a bar chart with labels like the pie chart. I need to be able to create the labels outside the column and create that line to them. Just like the pie chart does here:
http://www.highcharts.com/demo/pie-basicI have a Stacked Bar Chart that shows percentages and the labels wont be visible if the value is too small. or if I make them visible they will be overlapping.
Here is an Example Fiddle to show the problem
http://jsfiddle.net/xdbLscn7/24 votes -
Data labels with collision avoidance and connectors for scatter and bubble charts
Scatter and bubble charts do not seem to support collision avoidance for data labels. Along with collision avoidance, connectors that link the points to the data labels would be very helpful.
Thank you for the great library.
24 votesAs you can see from http://jsfiddle.net/highcharts/2cu52v0e/, there is currently collision avoidance.
It hides colliding data labels, but it doesn’t move them, and subsequently doesn’t add connectors.
-
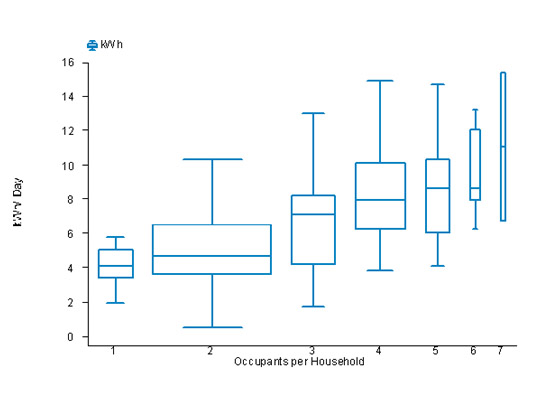
Variable widths for Box Plots
Variable widths for box plots is a popular convention (see https://en.wikipedia.org/wiki/Box_plot#Variations). Variable width box plots illustrate the size of each group whose data is being plotted by making the width of the box proportional to the size of the group. For example:
http://www.fsec.ucf.edu/en/publications/html/FSEC-PF-369-02/images/pf369-10a.jpgSo, there should be a way to provide pointWidth for each data point of box plot. Also, this feature should work seamlessly with multiple series.
Issue has already been filed to Github: https://github.com/highcharts/highcharts/issues/5441
24 votes -
Require scrolling feature
If I tend to display huge volume of data, chart GUI is not stretching to accomodate all contents, instead it reduces their dimensions to incorporate them within given area. This makes chart unreadable, also leads to overlapping of data during display. It will be great if chart length grows horizontally on more data and provides a scroll bar
23 votes -
Ability to persist tooltip post mouse leave.
Would like the ability to keep the tooltip shown after the users mouse has left the chart. Pretty easy to add.
Add option tooltip.sticky
Current 3.2.0.
Line: 1613. Add sticky: false.
Line: 8672. Add && !chart.options.tooltip.sticky.
Line: 8618. Wrap with if statement (!chart.options.tooltip.sticky).23 votes -
Restore "target" option in the "credits" configuration
It would be most useful to restore the "target" option in the "credits" configuration so that when the user clicks on the credit text (usually in the lower right angle of the graph), the link can be opened in a new page instead of the current one.
22 votesHere’s a small plugin that you can use that alters the click handler to simulate a HTML anchor click including a target: http://jsfiddle.net/highcharts/ud795/
-
Tooltip delay
I would like the tooltip to have a 'initial delay' - such that it acts more like a typical tooltip. I.e. the tooltip only shows after the mouse is stationary for a specified time, and then tracks data points instantly once shown.
Additionally, I would like the tooltip to be able to be replaced by a callback which provided the point values, such that they could be displayed elsewhere. So, for example, I might want to display the values of the currently tracked points in a div to the right of the graph, while still retaining the crosshair functionality.
22 votesHere’s a snippet that adds an optional delay to the initial tooltip display: http://jsfiddle.net/highcharts/xb4ax7v0/
Does this fix your problem?
-
Geo chart is really cool, dont you think. http://googlevisualr.herokuapp.com/examples/interactive/geo_chart
Geo chart is really cool, dont you think. http://googlevisualr.herokuapp.com/examples/interactive/geo_chart
22 votes -
Set off negative against positive values in stacked charts
It should be possible to sum up negative and positive values in the same stack (like excel does for area charts by default).
Currently positive and negative values are stacked seperately above and below the x-axis. To keep BC and keep the old behaviour as well a new stacking mode should be added IMHO.
22 votesThis is the corresponding GitHub issue: https://github.com/highslide-software/highcharts.com/issues/1059
-
Different attributes for inside, outside and separator borders of pie chart
For the slices of a pie chart, allow the user to specify border attributes differently for inside, outside and separator borders. I would like to specify no border for the outside and inside of a donut chart, but still have borders between the slices.
22 votes -
Exporting charts just by right clicking on them
Hi
I would like to suggest a small improvement concerning exporting. At the moment, user that wants to save a highchart has to click on a download icon and choose an option from a dropdown.
A small but great improvement would be to do the same, just by right-clicking on a chart.You just right click on a chart -> save as -> desired format and voila!
I am not sure if sucha feature is possible to implement, but it would be neat to have this! :)22 votesI did an attempt at http://jsfiddle.net/highcharts/spaa2he9/, but it is quite unstable. Maybe it can serve as a starting point for you to figure out how to enable it.
-
Support for (non-breaking space) for legends, labels and categories
It would be great to control line breaks completely using non-breaking spaces ( ), <br> tags and soft hyphens ().
22 votes -
Auto-PlotLines for Min, AVG and Max values
Auto-Plotlines for aggregate functions like Min, AVG and Max based on the series values.
This would be accessible via the series or plotline objects and would draw the lines automatically (ui default properties for each plotline defined as well and not null) for the aggregates on the values of the series.
22 votes -
Add icon to email pdf chart to an address
There is the ability to print a chart and to create a pdf of it, would be great to have email option to email a pdf of chart to someone
21 votes -
Allow images to be included in axis labels
Provide some way of including an image in an axis label. For example, I may want to prefix the axis labels with an icon.
I've tried including HTML in the axis label and using axis.labels.formatter to add image HTML into the label. Neither worked. I've seen reference to using renderer for doing this, but I haven't been able to find an example.
21 votesThe key is setting useHTML to true: http://jsfiddle.net/highcharts/8FSp6/.
Here’s another approach, allowing true SVG images: http://jsfiddle.net/gh/get/jquery/1.7.2/highslide-software/highcharts.com/tree/master/samples/highcharts/studies/axis-label-images/. The advantage of using SVG is that these images willl be visible in the exported chart as well.
-
HIghcharts js for mobile
highcharts is a litter larger for mobile,should we have a mobile edition? highcharts should not rely on other frameworks as well,such as jquery.
21 votes -
Add calendar widget (Jquery Date picker) to the range selector input fields to highstock.
Entering date manually is a little outdated using a date picker would provide a better interaction.
21 votes -
tickmarkPlacement for xAxis set as datetime not categories
What I am after is to do exactly what the tickmarkPlacement:'between' setting does for categories. Except I need it for dates. This is a pretty fundamental charting option that should be available.
If I'm doing a chart that is over 12 months and I'm showing the months on the xAxis, I want the labels to be in between the ticks as that represents the month not on the tick that separates one month from the next.
If there is a way of doing this I would love to know. I can't use the label x setting as the charts are…
21 votes
- Don't see your idea?