402 results found
-
Up and Down Border Colors on Candlesticks
You added upColor along with regular color on Candlesticks - this is a great start. However, almost all Candlestick charts offer differing border colors as well, an upBorder and downBorder if you will. If you would add this so we could base it on a real stock chart's open, high, low and close this would be a TREMENDOUS improvement.
36 votes -
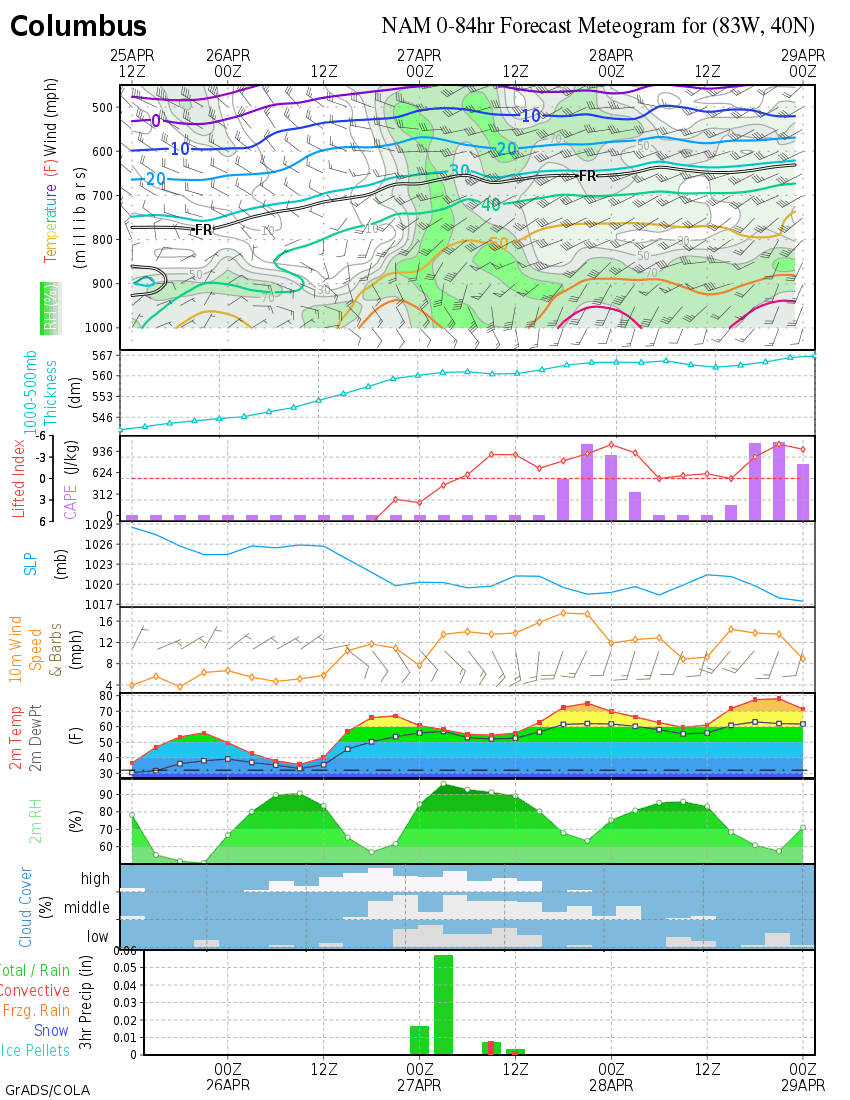
wind barb and vector plot
It would be very useful to be capable of plotting wind barb and vector arrow as a type of plot. This would allow us to plot 2 dimensional data (value, direction) alongside other line or column plots (i.e. temperature, pressure, etc.)
Example:
wind barb:
- http://weather.unisys.com/surface/meteogram/met_KBOS.gif
- http://wxmaps.org/pix/cmhnam.png
- http://www.meteoblue.com/public/fileadmin/meteoblue/pictures/Products/POINT_meteogram_day6_wind_080428.pngVector:
http://www.nortekusa.com/usa/library/images/duck-awac-8m-wave-vector-plot
http://www.marineweather.co.nz/forecasts/north-cape
- http://www.seabreeze.com.au/graphs/tasmania.asp34 votesWind barb is here:
https://www.highcharts.com/docs/chart-and-series-types/wind-barbs-seriesVector is here:
https://www.highcharts.com/docs/chart-and-series-types/vector-plot -
Support TopoJson
Support topoJson format in HighMaps. This format is about 80% smaller than geoJson
34 votes -
legend title
I've searched the forum and docs and not found an answer
Would be nice if we could set a legend title. Our users are beginners at reading graphs and every little bit helps.33 votesImplemented as of Highcharts 3.0.
-
Add background options to datalabels
I am using a column chart in conjunction with a line chart. The problem is that the line intersects with datalabel of the column and makes it harder to read. See
http://i51.tinypic.com/34pj3tk.png
It would be great if I could add a white background color to the datalabel and increase its readability.
33 votes -
An option for preventing a chart from interfering with iPhone scrolling
Charts capture scrolling events on an iPhone or iPad, making scrolling the page by flicking on the chart area impossible. An option for changing this behavior would be desirable.
Refer to:
33 votes -
Angular 2 support
It would be nice to have native Angular 2 support. So far, it's a little bit complicated to implement Highcharts with Angular 2 (without relying on 3rd-party plugins.
33 votesHighcharts Angular 2+ official wrapper is available here:
- https://github.com/highcharts/highcharts-angular
- https://www.npmjs.com/package/highcharts-angular -
overlaid column chart
The current stacking options are: null to disable, "normal" to stack by value or "percent".
Another visualization is to overlay the columns (usually requiring the use of transparency).
As a comparison, please see the stacking options offered by Flex:
http://livedocs.adobe.com/flex/3/html/help.html?content=charts_displayingdata_11.html
30 votesOverlaid column charts are supported by setting grouping to false: http://api.highcharts.com/highcharts#plotOptions.column.grouping
-
Building stack bottom up
Hi,
We want to add stacks in reverse order without touching legends order. I tried to dig into code and found that while (i--) unconditional
you can add new property so that generic solution can be applied
Code as in 3.0.7
   /**
   * Build the stacks from top down
   */
   buildStacks: function () {
          var series = this.series,
                 i = series.length;
          if (!this.isXAxis) {
                 while (i--) {
                       series[i].setStackedPoints();
                 }
                 // Loop up again to compute percent stack
                 if (this.usePercentage) {
                       for (i = 0; i < series.length; i++) {
                              series[i].setPercentStacks();
                       }
                 }
          }
   },
Proposed code with new property
buildStacks:…
30 votes -
Highcharts as a CommonJS Asynchronous Module
Hello,
Please add the following code in Highcharts:
// Expose Highcharts as a CommonJS Asynchronous Module
if ( typeof require !== "undefined" && require.def ) {
require.def( [], function () { return Highcharts; } );
}This code would register Highcharts as an CommonJS asynchronous module.
It would make Highcharts easier to use when working with RequireJS (and other loaders).
I pasted more links for modules and loaders are discussed.
http://dev.jquery.com/ticket/7102 (<--- this will expose jQuery as a module)
http://github.com/jrburke/jquery/commit/93dc7a7e3c383ff8a6507342af7e14821bef8d9b
http://groups.google.com/group/requirejs/browse_thread/thread/65eddc9f35c9e4cf
http://tagneto.blogspot.com/2010/09/anonymous-module-support-in-requirejs.htmlThank you.
Les
29 votes -
Allow specification of number of tickmarks
Allow option of specifying the number of tickmarks to display, rather than the range or interval of them.
29 votesThis was implemented as of Highcharts 5.0.
-
Tooltip image
Support embedding images in tooltips.
27 votesCan be accomplished using the tooltip.useHTML option.
-
sunburst
Extend the donut pie chart to show all data points as a subsection of the inner layer:
27 votesImplemented! Demo: https://www.highcharts.com/demo/sunburst
-
27 votes
Implemented! See API: https://api.highcharts.com/highcharts/xAxis.plotBands.borderWidth
-
Fix spline plots to draw a better generalized line.
Current spline plots can be unintuitive when your dataset isn't quite a perfect curve. A dataset of 10,10,10,0 shows a huge spike in the line right when it really shouldn't exist.
24 votesVersion 2.1 released
-
Add a built in table parser
A built in table parser would allow that the data be defined in a table in the HTML page. If JavaScript is disabled in the browser, the table will still show.
23 votesCompleted, see http://api.highcharts.com/highcharts#data.table
-
allow line charts to handle missing data without interpolating
When drawing a line chart, one should be able to specify the interval between x axis points and whether to interpolate or not at missing x axis locations. That way, if [x,y] data is missing some x locations, we don't have a line at the missing points. This is similar to creating an [x,y] pair at each point and specifying NULL, but in some cases creating an [x,y] pair for all missing points isn't practical.
23 votes -
Provide option to automatically wrap long labels
Wrap long text labels on axes.
There is a nice summary of the enhancement request here, http://highslide.com/forum/viewtopic.php?f=9&t=8380&p=39252&hilit=wrap#p39252
22 votes -
Add support for changing series colors
As a user, I'd like to be able to easily update a series' color in an event handler.
22 votes -
I created a polar spider graph and I would like to know if it is possible to set scale (min and max) for each categories.
I would like change the min and the max, ie for a category A I have values from 0 to 200 and for another category B from 0 to 1. Currently, category B, I do not see very well because the scale is 0 to 200.
22 votesThis is implemented now as a polar parallel coordinates chart, will be available as of next maintenance release: http://jsfiddle.net/highcharts/dxq8hrd5/
- Don't see your idea?