1073 results found
-
Add Renko chart type to the charting cabability, here is a link for charting Renko
Create highstock renko chart type. https://stockcharts.com/school/doku.php?id=chart_school:chart_analysis:renko
21 votes -
Add paging to column charts
if the list of columns are to big to display, I would like a way to paginate them and show the columns in groups of 10, 20, etc.
20 votes -
Heatmap highlight row/column of a given category
The user would click a given category name, for instance, on a list, and the heatmap would highlight the row/column that corresponds to that category. This would allow for users to look for columns/rows if interest in a faster way, especially when dealing with big datasets.
20 votes -
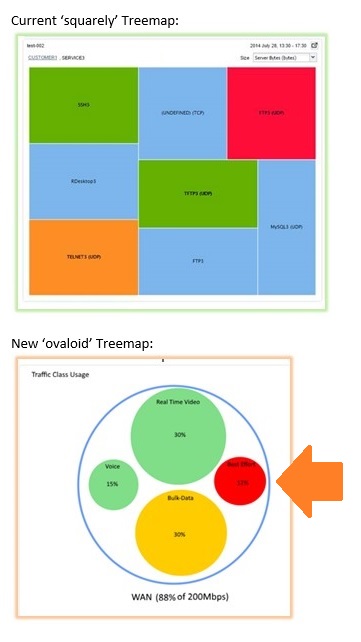
Circular Treemap charts
Instead of having Treemap as groups of rectangles, we can have it as group of circles.
Something like this:
- http://coolmoviebrowser.free.fr/img/circular-treemap.jpg
- http://www.addictivetips.com/windows-tips/analyze-disk-space-usage-via-7-tree-based-data-structure-visualization-treeviz/Hope you can do it :)
Regards,
Sorinel20 votes -
sparklines
Create sparklines like in Google analytics
19 votes -
Wordpress Plugin
A plugin where one can upload a CSV file and in turn it creates a graph of its own, like a page.
19 votes -
Explicit support for drill-down Ajax interactive data zooming
I have an extremely large dataset (once-a-second measurements extending over several years) that I'd like to be able to zoom in (and out) interactively with the Highstock navigator as well as direct selection with the mouse.
I think I have finally managed to piece together a somewhat stable solution by using the rather under-documented setExtremes event. However, some slight instabilities remain, mainly due to the fact that the setData method appears to itself trigger the setExtremes event sometimes. In addition, my dataset is discontiguous (has many gaps) and Highchart seems to like to shrink the limits of the selected data…
19 votes -
highlight axis when passing over series
When a chart have several axis it is not easy to see which axis has to be used with a serie.
A solution migth be to higlight (like columns) axis when the mouse passed over a serie
19 votes -
Support extending step lines to the edge of the chart
Currently, on a chart with multiple series having distinct x values, step lines can look awkward when one series ends before another.
My immediate desire is simply to have an option to extend step lines to the right-hand edge of the chart. It should work when addPoint() is used on another series and the chart is redrawn. That is, all series drawn with the "step" option should be drawn as-if they have an additional point like [chartmaxx, serieslasty].
I don't need full extrapolation capabilities, that is, I'm not asking for any logic to decide how to…
19 votes -
Linear gauge
Would love to have linear gauges like this:
http://www.russell.com/Helping-Advisors/Markets/EconomicIndicatorsDashboard.aspx
19 votesYou can create linear gauges from columns or scatter charts with one single data value: http://jsfiddle.net/highcharts/9ybLv5je/.
Other examples:
- Filler gauge: http://jsfiddle.net/highcharts/amfbptkw/
- Marker gauge: http://jsfiddle.net/highcharts/7mcq4az6/
- Thermometer gauge: http://jsfiddle.net/highcharts/Y7F3F/
-
add more html tag support
We're trying to add some superscripted text to chart subtitles, but the <sup> tag is not supported. Can you add support for some more html tag support for tags like <sup> and <sub>
19 votes -
Allow chart to determine/set auto-height/width.
See here: http://forum.highcharts.com/post115029.html
This would add a chart width/height setting of "auto". For bar charts, the auto height uses the point width and padding options to determine the "correct" height of the plot box, instead of using the size of the container. For column charts, the chart would grow/shrink horizontally to fit all columns.
19 votesWe experimented with this in http://jsfiddle.net/gh/get/jquery/3.1.1/highcharts/highcharts/tree/samples/highcharts/studies/axis-staticscale/
-
19 votes
It’s a good idea, Iit would require that we either are able to send images directly from the browser memory to the social media APIs, or that the export server passes the images to the APIs.
-
Support custom fonts in graph exports
When exporting graphs to any format, if you are using a custom font that is not installed on the user's computer (even if you are using the CSS @font declaration to include it for your site), the font will not be used on the exported chart.
Example:
http://jsfiddle.net/n2rcogxa/You should be able to solve the issue by embedding the base64-encoded font in the SVG document prior to converting from SVG to whatever the desired format is (PNG, JPG, PDF, etc).
Example:
http://jsfiddle.net/moyf3zvb/2/Note you must actually embed the font. Including it as a @font declaration in the SVG document does…
19 votes -
Static image rendering for performance
The dynamic SVG plots could be replaced by a static image of the plots, similar to how the exported PNG looks. The choice between dynamic and static could be made at runtime based on the size of the dataset.
I'm generating scatter plots based on data from a database. The plots looks great, however the performance gets to be a probably when the plot has more than 1000 points.
18 votes -
Averages (mean/median/mode)
Include average information with each chart. This could include mean, median, and mode.
18 votes -
Support "dblclick" event
Please support "dblclick" event for chart, series, and point.
18 votes -
Enable/disable resizing of bottom navigator
Currently, handles exist for expanding or contracting the date range. I would like the ability to remove the handles so the user can only scroll left and right without being able to zoom.
18 votes -
Reverse order in stacked charts
The current logic for the "normal" stacking is that the series are stacked from the top to the bottom. There should be an easy way to reverse the order, our users are used to build the stack from the bottom to the top and not vice versa. I suggest adding something like plotOptions { stackingOrder: 'reversed' }// default 'normal'
18 votes -
Support more intuitive legend customization - (maxHeight/navigation issue)
Namely, I have an issue with the misleading maxHeight property. If you are digging deep enough in the docs to customize the legend to use maxHeight, this property's value should be taken as gospel.
Either that or allow for the navigation (pagination) of the legend to be disabled without having to have useHTML enabled.18 votes
- Don't see your idea?