1073 results found
-
Seperate tooltip pointFormat for nullvalues
If i have a NULL value and
tooltip.pointFormat: '{series.name}<br />{point.x:%e %b, %Y} {point.y}:00: <b>{point.value:,.4f}</b>'The tooltip will be:
ABC<br /> 01.01.2014 30:00 0.0000
but better solution would be:
ABC<br /> 01.01.2014 30:00 No valueHere an example:
http://jsfiddle.net/25MyN/20/Something like
tooltip.nullPointFormatwould mek alot easyer.
2 votes -
Redraw funnel chart the same way as pie chart when a slice is removed
Pie chart ( and others ) redraws when a slice is removed . Example http://jsfiddle.net/2Me2z/134/
When removing a slice , other slices will expand and take up the spaces. Is there a way to have the same behavior on funnel chart?
Same question on stackoverflow:
http://stackoverflow.com/questions/22766844/redraw-funnel-chart-in-highchart-when-a-segment-is-removedThanks
2 votes -
Add colision detection, support for single line chart
Add colision detection, support for single line chart. http://forum.highcharts.com/highcharts-usage/datalabel-overlap-t29658/
2 votes -
would be good to have global rtl option
it would be good to have rtl option in global lang. it will simplify the implementation for switching feature between rtl & ltr
2 votes -
please add 3d arrow markers (refer http://jsfiddle.net/qy4chs3y/13/)
we need arrow in the z-axis. I have written an example in jsfiddle as mentioned above. I need the arrows to be shown in 3D (z axis)
2 votes -
Add Palestine country
https://en.m.wikipedia.org/wiki/Palestine
Will you add Palestine to your work sites such forebears.co.uk2 votes -
CBSA
Is there any way to plot US map with cbsa boundaries ?
2 votes -
Option to export PDF to dataUri string instead of downloading
It would be nice to have an option to export chart (as PDF) to datauri string instead of file.
This can be done now indirectly, by obtaining chart's underlying svg, calling svg2pdf and finally using jsPDF doc.output('datauristring')
[which returns the base64 dataUri] instead of downloading file.Maybe as an option in 'exporting' object?
Or by exposing new method, i.e. Highcharts.exportToUri() ?Or maybe there's some simpler way that I am not aware of?
Thank you.2 votesThank you for your request! By extension, this applies to PNG and JPEG exports in addition to PDF. You can override the Highcharts.downloadURL function to capture the dataURI. See http://jsfiddle.net/highcharts/9my975x4/.
-
HighStock ios
It would great to have HighStock support in cocoapods for ios.
2 votes -
maxStaggerLines - reimplementing it as a plugin
Votes tracker for https://github.com/highcharts/highcharts/issues/3853
2 votes -
Many-to-many relations/interactions of charts
This suggestion is an outcome of my longtime involvement with the modelling of many-to-many communications, initially at the RAND Corporation and subsequently at the University of Oxford with some intriguing results in applications such as predicting voter behaviour (see this article http://analytics-magazine.org/voter-motives-and-messages/).
Recently, I found myself involved in the objective analysis for the determination of the best e-banking UI; as it is apparent that soon enough the best bank will be the one with the best UX/UI design.
Here we used highcharts to visualise our findings. Corellating for example the Use Case scores vs. the Functionalities available using a…
2 votesThanks for your suggestion! This is partly covered by the crossfilter functionality as previously requested: https://highcharts.uservoice.com/forums/55896-highcharts-javascript-api/suggestions/3337427-crossfilter.
-
Add categories
Hi
There are a categories in the chart for several tasks
An example in the link https://www.highcharts.com/gantt/demo/interactive-gantt is to add a task that is not what we want.
Is it possible to add and edit categories?
For example, there's a button to get a text and add to the list of categories
Thank you2 votes -
Dynamic quadrant scatter plot
Ability to move x,y cross inside scatter plot to divide or split data clusters into quadrants.
2 votes -
Highlight background color between multiple series in highcharts
i want to highlight series between graphs.
Please check the JS fiddle http://jsfiddle.net/je4xc5bf/1/
but i want to highlight chart like type:"arearange"
without forming the new Series2 votes -
enable resize option for annotation labels shape
Expected behaviour
Currently we have annotations label shapes are like this
Actual behaviour
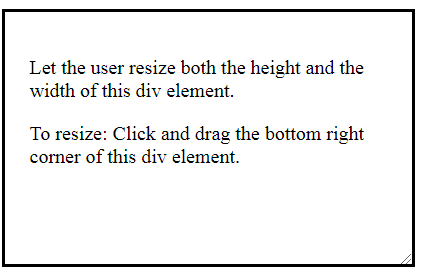
I need the annotations labels to respond to resize option , that html provides like this
Could you please help out in achieving this ?
2 votes -
Support for exporting chart in multiple pages
Currently we are not able to export a chart in multiple pages. So, in case the chart is long, and I want the point width of a bar chart to specific value I would like to export it in multiple pages. It would be good if you implemented this feature as soon as possible.
2 votes -
annotation copy and Paste
it would be really nice to have copy and paste selected annotation on screen. many of our customers are asking for it..
like here https://www.tradingview.com/chart/
add annotation and select and press ctrl + c just like normal copy and paste..
2 votes -
Add Custom Data to View DataTable
Add the ability to add custom data to view data table.
Specifically add custom mean/mid/mode value from dumbbell chart to view data table .2 votes -
How to create pyramidal graph with bar chart and series: stacking: 'pyramidal'
To create a pyramidal chart in first time, it's necesary to add over line 4816 of hightcharts.src.js the next code:
if (stacking == 'pyramidal'){
yValue = yValue - yBottom;
}To show a pyramidal chart, the plotOptions can be set:
plotOptions: {
series: {
stacking: 'pyramidal'
}Finally one of the series can be with negatives values to show de bar opposite with the other serie.
1 vote -
fourfold table
to analyse product sales (dogs/stars) etc.
1 vote
- Don't see your idea?
